
Continuity and Differentiability
Loading the math board and drawing, please wait…
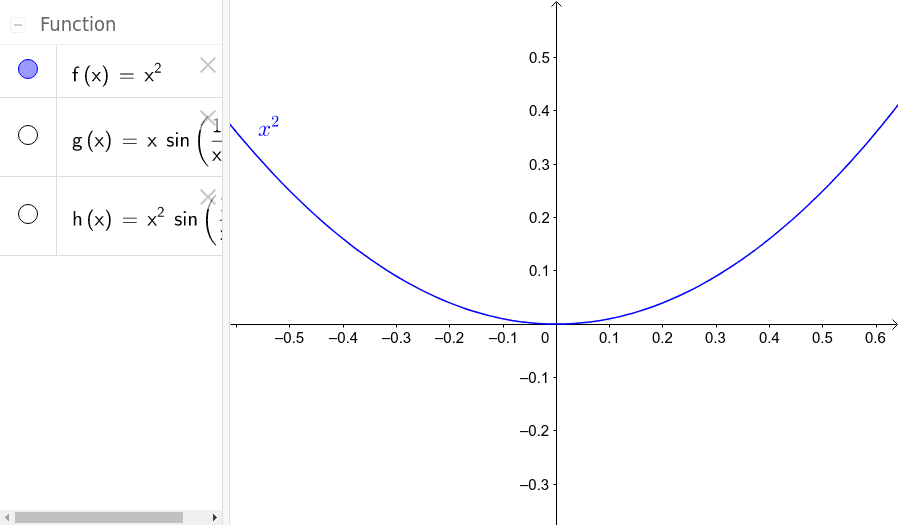
This example illustrates the concepts of continuity and differentiability. By analyzing the graph of a function, one can intuitively understand whether a function is continuous and differentiable at a point. The construction uses function objects g, h, and f. Suitable for high school mathematics education and learning.
GeoGebra Commands & Parameters
g(x) = (x * sin(1 / x))h(x) = (x^(2) * sin(1 / x))f(x) = x^(2)
AI Drawing Prompt Reference
Draw a set of function graphs to illustrate continuity and differentiability. First, plot g(x) = x * sin(1 / x), then plot h(x) = x^2 * sin(1 / x), and finally plot f(x) = x^2. By observing these graphs, you can intuitively understand whether the functions are continuous and differentiable at a point.
The prompt above was compiled from the original drawing commands and is for reference only.