
Connectivity Matrix: Visualizing Vertex Links in a Tetrahedron
Loading the math board and drawing, please wait…
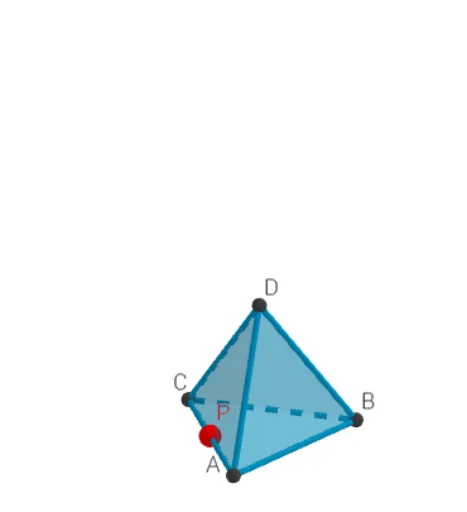
This GeoGebra example demonstrates a connectivity matrix (adjacency matrix) for a tetrahedron, visually mapping which vertices are connected by edges. The core mathematical concept is graph theory's adjacency matrix, applied to the six edges of a tetrahedron, combined with solid geometry of vertices, edges, and faces. Construction highlights: the Tetrahedron command creates the solid; vertices A, B, C, D and edges RibbeAB, RibbeAC, etc. are defined; TableText generates the matrix table; Circle, Intersect, Rotate, and Point assist in labeling and rotating the view; objects like rijA, rijB store matrix rows, while MM and n handle matrix operations. Suitable for high school or university students learning solid geometry, introductory graph theory, or matrix applications, and useful for demonstrating network connectivity in mathematical modeling.
GeoGebra Commands & Parameters
TableText({{"A", "B", "C", "D"}}) → tekst2TableText({{"A"}, {"B"}, {"C"}, {"D"}}) → tekst3Circle(O, 1, xOyPlane) → cIntersect(yAxis, c, 2) → ARotate(A, 90°) → BPoint(Circle[Midpoint[A, B], (Distance[A, B] * sqrt(3) / 2), Segment[A, B]]) → CTetrahedron(A, B, C) → a, D, RibbeCD, RibbeBD, zijvlakABC, zijvlakACD, zijvlakABD, zijvlakBCD, RibbeAC, RibbeAB, RibbeBC, RibbeADPoint({RibbeAB, RibbeAC, RibbeAD, RibbeBC, RibbeBD, RibbeCD}) → PP