
Visualizing the Connectivity Matrix of a Cube
Loading the math board and drawing, please wait…
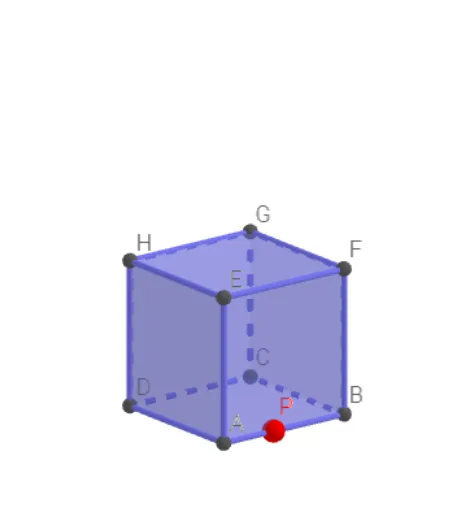
This GeoGebra example constructs a cube and generates a connectivity matrix using TableText, visually representing the adjacency relationships among the cube's vertices. The core mathematical concepts include graph theory (adjacency matrix) and solid geometry (vertices, edges, faces of a cube). The construction uses commands such as Circle, Intersect, Rotate, Cube, TableText, and Point, with objects including vertices A through H, face polygons (zijvlakABCD, etc.), edges (RibbeAD, etc.), and lists (lijstA to lijstH) that store vertex data. The matrix is displayed as a table, making the connectivity explicit. This example is suitable for high school or early college students, serving as a visual aid for understanding graph representations and their geometric interpretations, and can be used in mathematics or computer science courses.
GeoGebra Commands & Parameters
Circle(O, 1, xOyPlane) → cIntersect(yAxis, c, 2) → ARotate(A, 90°) → BCube(A, B, zAxis) → a, C, zijvlakBCGF, zijvlakCDHG, zijvlakEFGH, RibbeAD, RibbeAB, RibbeBC, RibbeCD, RibbeAE, RibbeDH, RibbeEH, D, RibbeEF, RibbeBF, RibbeFG, RibbeCG, RibbeGH, E, F, G, H, zijvlakABCD, zijvlakADHE, zijvlakABFETableText({{"A", "B", "C", "D", "E", "F", "G", "H"}}) → tekst2TableText({{"A"}, {"B"}, {"C"}, {"D"}, {"E"}, {"F"}, {"G"}, {"H"}}) → tekst3Point(ribbenlijst) → P