
Connectivity Matrix: Visualizing Polygon Vertex Connections
Loading the math board and drawing, please wait…
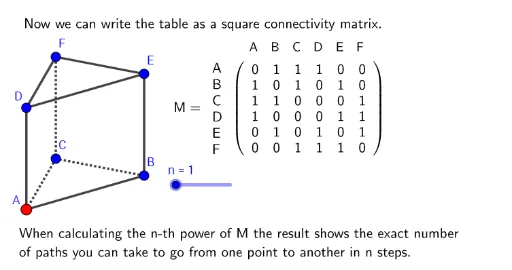
This GeoGebra example demonstrates a connectivity matrix by visualizing the connections between vertices of polygons. It illustrates how a matrix can represent adjacency in geometric figures. Core concepts include graph theory adjacency matrices, polygon geometry, and matrix representation. The construction uses ConstructionStep for step-by-step building, Polygon to create polygons, Segment and Vector for edges and vectors, Point for vertices, TableText to generate the matrix table, and If for conditional display. Objects include multiple triangles, quadrilaterals, segments, and vectors, culminating in structures like ribben1. Suitable for high school or early college students learning the link between matrices and geometry, or as an introduction to graph theory in discrete mathematics.
GeoGebra Commands & Parameters
ConstructionStep() → stapPolygon(A, B, C) → driehoek1, c, a, bPolygon(D, E, F) → driehoek2, f, d, eSegment(D, A) → gSegment(F, C) → hSegment(E, B) → iPolygon(G, H, 3) → veelhoek1, j, k, l, IPolygon(J, K, 3) → veelhoek2, m, n_1, p, LVector(A, J) → uVector(B, K) → vVector(C, L) → wVector(D, G) → qVector(E, H) → rVector(F, I) → tPoint(ribben1) → PTableText({{"A"}, {"B"}, {"C"}, {"D"}, {"E"}, {"F"}}) → tekst3TableText({{"A", "B", "C", "D", "E", "F"}}) → tekst5If(n ≟ 1, "", tekst7) → tekstnTableText({{"A ", "B ", "C ", "D ", "E ", "F "}}) → tekst9