
Confidence Interval Variation
Loading the math board and drawing, please wait…
In collections
Confidence Intervals
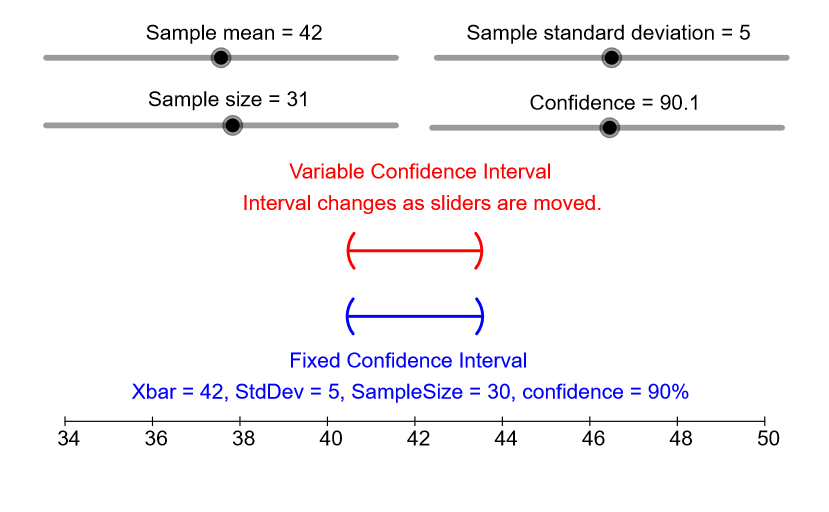
This example demonstrates the dynamic changes in confidence intervals. It involves core statistical concepts such as confidence intervals, standard deviation, and sample size. Using GeoGebra commands like Segment, CircleArc, and Sequence, the construction process of confidence intervals is visually demonstrated. Suitable for students studying statistics and probability.
GeoGebra Commands & Parameters
Segment(LeftFixEnd, RightFixEnd) → FixIntSegment(LeftVarEnd, RightVarEnd) → VarIntCircleArc(LeftFixCent, LeftFixTop, LeftFixBot) → LeftFixCapCircleArc(RightFixCent, RightFixBot, RightFixTop) → RightFixCapCircleArc(LeftVarCent, LeftVarTop, LeftVarBot) → LeftVarCapCircleArc(RightVarCent, RightVarBot, RightVarTop) → RightVarCapSegment(P34, P50) → XaxisSequence(Segment[(k, 0), (k, -0.2)], k, 34, 50, 2) → Tics, {0.2, 0.2, 0.2, 0.2, 0.2, 0.2, 0.2, 0.2, 0.2}Sequence(Text[k, (k - 0.175, -0.65)], k, 34, 50, 2) → Labels, {"34", "36", "38", "40", "42", "44", "46", "48", "50"}
AI Drawing Prompt Reference
Draw a graph showing dynamic confidence intervals, including fixed and variable intervals with arcs, labeled values from 34 to 50 in steps of 2, a central line passing through the middle, with top and bottom arcs on both sides, vertical tic marks, and value labels below the tics.
The prompt above was compiled from the original drawing commands and is for reference only.