
Confidence Interval Problems
Loading the math board and drawing, please wait…
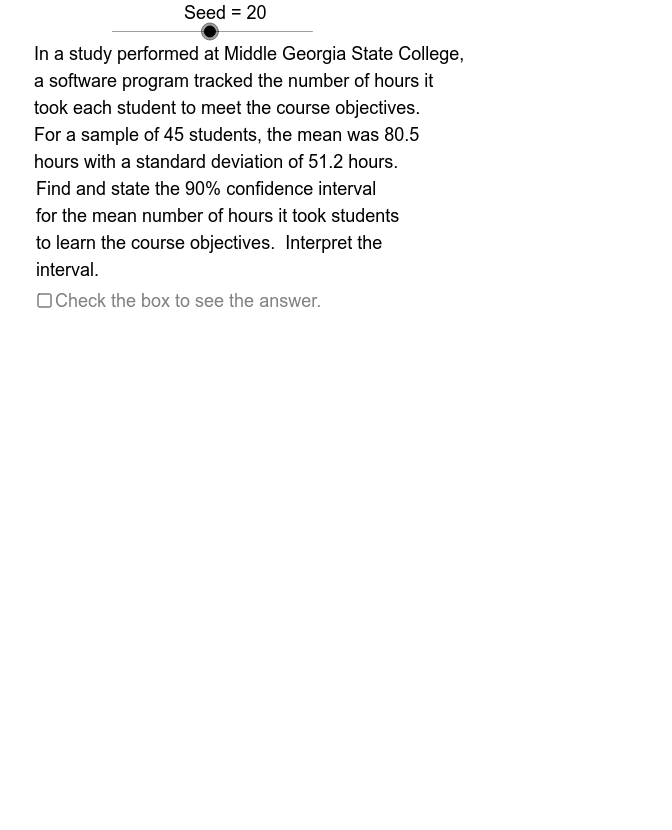
This applet provides numerous problems on computing confidence intervals for means and proportions. Users can see the answers by checking the check box. The example involves core statistical concepts such as confidence intervals and probability distributions. Using GeoGebra commands like Element, Sequence, and If, users can understand the process of calculating confidence intervals. Suitable for statistics and probability courses.
GeoGebra Commands & Parameters
Element(CfSq, Mod[Seed, 4] + 1) → CfdSequence(Mod[7 + (23 * k), 40] + 1, k, 1, 40) → OpSqElement(OpSq, Seed) → OpElement(PpNSq, ElmNo) → PpNElement(PpXSq, ElmNo) → PpXIf(DsCh ≟ 3 ∨ DsCh ≟ 5 ∨ DsCh ≟ 9, 100, 1000) → RndFctElement(MnXbrSq, ElmNo) → XbarElement(MnStDvSq, ElmNo) → MnStDvElement(MnNSq, ElmNo) → MnNMod(Op, 2) → ChcIf(Chc ≟ 0, MnAs2, PpAs2) → As2Element(DsSq, Mod[Op, 10] + 1) → Ds00Element(PSSq, Mod[Op, 10] + 1) → PS00Vector(MnAT, MnAH) → MnArVector(PpAT, PpAH) → PpArIf(Chc ≟ 0, MnAs1, PpAs1) → As1If(Chc ≟ 0, MnAs3, PpAs3) → As3If(Chc ≟ 0, MnAr, PpAr) → ArIf(Chc ≟ 0, MnCfId, PpCfId) → CfId
AI Drawing Prompt Reference
Create a statistical teaching interface with two main panels: left for mean confidence interval problems)Skip, right for proportion confidence interval problems. Each panel shows a randomly selected dataset with sample mean, standard deviation, sample size or proportion data, along with corresponding confidence interval arrows and numeric labels. The top has problem number and random seed controls, bottom has an answer checkbox revealing computed intervals. Layout is clean for classroom demonstration, emphasizing visual comparison of probability distributions and interval estimates.
The prompt above was compiled from the original drawing commands and is for reference only.