
Conditional Relative Frequencies as Percentages of the Total
Loading the math board and drawing, please wait…
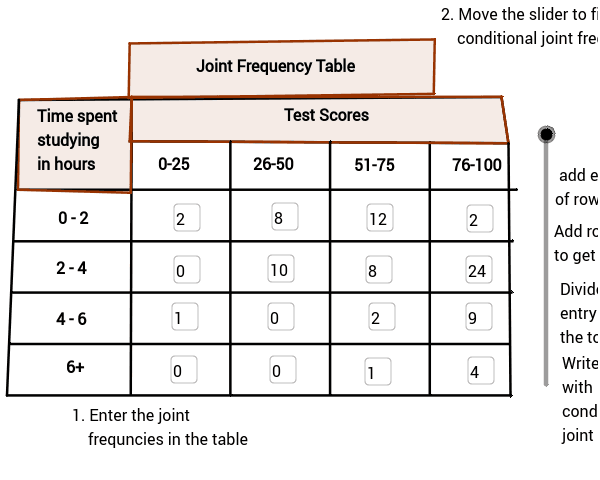
This GeoGebra example demonstrates how to compute conditional relative frequencies and express them as percentages of the total. It covers core concepts in probability and statistics, including conditional probability, relative frequency, percentage conversion, fractions, and part-to-whole ratios. The construction relies on GeoGebra commands such as Textfield, Segment, Polygon, and Vector, together with numerous points and objects including A2, B1, E2, B3, B4, C3, D3, E3, C4, D4, E4, IB3, IB4, IC3, IC4, ID3, ID4, IE3, IE4, B5, C5, D5, E5, A4, TA4, B2, TB2, C2, TC2, D2, TD2, TE2, TB1, A, C, D, b, E, G, and I. Segments, polygons, and vectors are used to build a visual framework for exploring frequency distributions under conditional constraints. Suitable for middle school and high school probability and statistics units, this resource supports classroom instruction by teachers and independent inquiry by students learning how to calculate and interpret conditional relative frequencies.
GeoGebra Commands & Parameters
Textfield(B3) → IB3Textfield(B4) → IB4Textfield(C3) → IC3Textfield(C4) → IC4Textfield(D3) → ID3Textfield(D4) → ID4Textfield(E3) → IE3Textfield(E4) → IE4Segment(C, D) → bSegment(I, J) → eSegment(A, M) → gSegment(N, K) → hSegment(M, K) → iSegment(O, P) → jSegment(Q, R) → kSegment(S, T) → lPolygon(C, N, K, M) → poly1, n, p, q, rPolygon(C, U, O, A) → GradePoly, s, t, a_1, b_1Segment(A, S) → aSegment(K, T) → fVector(C_1, D_1) → u_1Vector(E_1, F_1) → v_1Vector(G_1, H_1) → w_1Polygon(I_1, J_1, K_1, L_1) → Title, i_1, j_2, k_1, l_2Segment(B, F) → cSegment(H, L) → dSegment(E, V) → mSegment(G, W) → c_1Textfield(B5) → IB5Textfield(B6) → IB6Textfield(C5) → IC5Textfield(C6) → IC6Textfield(D5) → ID5Textfield(D6) → ID6Textfield(E5) → IE5Textfield(E6) → IE6
AI Drawing Prompt Reference
Create a probability and statistics diagram that shows conditional relative frequencies as percentages of the total. Begin by drawing line segments that form a grid-like boundary with several adjacent cells. Add two polygonal regions, one as the main frame and one as a title area, then draw three arrows connecting neighboring regions to suggest frequency relationships. Place editable text boxes in multiple cells for entering conditional relative frequencies, total percentages, and explanatory labels. The result should resemble a classroom visual table for comparing frequency distributions under different conditions.
The prompt above was compiled from the original drawing commands and is for reference only.