
Comprehensive Function Graph Analysis: Extrema, Intersections, and Geometric Con
Loading the math board and drawing, please wait…
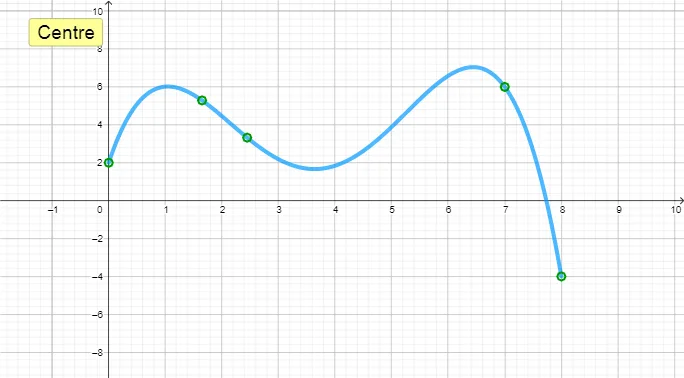
This GeoGebra example demonstrates a comprehensive analysis of a function's graph, including plotting the curve, determining the domain, finding extrema (maxima and minima), locating roots and intersections with axes, and constructing geometric elements such as the orthocenter. The core mathematical concepts involve function graphing, extrema, roots, intersections, domain intervals, and the orthocenter property in plane geometry. The construction uses GeoGebra commands such as Sequence, Max, Min, Extremum, Root, Intersect, RemoveUndefined, Union, Point, Segment, Midpoint, Length, and more, with objects like f, G, H, I, le, le2, l5, A5, l3, l4, le3, n, botón1, P, b, F, ec1, dominio, a, g, c, d, der, l2, and A1-A4. A slider (botón1) enables interactive control of the analysis. This resource is suitable for high school to university-level mathematics education, particularly for exploring function properties, curve sketching, and integrating algebraic and geometric concepts.
GeoGebra Commands & Parameters
Sequence(y(l1(k)), k, 1, Length[l1]) → lyMax(ly) → ymaxMin(ly) → yminSequence(x(l1(k)), k, 1, Length[l1]) → lxMin(lx) → xminMax(lx) → xmaxExtremum(f) → G, H, IRemoveUndefined(le) → le2Sequence(y(le2(k)), k, 1, Length[le2]) → l5Sequence(x(le2(k)), k, 1, Length[le2]) → l3Union(l3, {xmin, xmax}) → l4Unique(l4) → le3Point(f) → PSegment(F, P) → ec1Segment((xmin, 0), (xmax, 0)) → dominioSegment((0, y(P)), P) → gSequence(f'((le3(k) + le3(k + 1)) / 2), k, 1, Length[le3] - 1) → derSequence(If[der(k) > 0, "increasing", "decreasing"], k, 1, Length[der]) → l2Segment((B1, 0), (B2, 0)) → C1Segment((B2, 0), (B3, 0)) → C2Segment((B3, 0), (B4, 0)) → C3Midpoint(C1) → E1Midpoint(C2) → E2Midpoint(C3) → E3Segment((B4, 0), (B5, 0)) → C4Midpoint(C4) → E4Segment((B1, 0), (B1, f(B1))) → G1Segment((B2, 0), (B2, f(B2))) → G2Segment((B3, 0), (B3, f(B3))) → G3Segment((B4, 0), (B4, f(B4))) → G4Segment((B5, 0), (B5, f(B5))) → G5Union(l5, {ymin, ymax}) → l6Unique(l6) → l3eyLength(l3ey) → loSegment((0, l3ey(1)), (0, l3ey(lo))) → recorridoRoot(f) → J, K, L, MIntersect(f, yAxis) → N
AI Drawing Prompt Reference
Draw a function graph, highlighting its maximum and minimum points. Show the derivative curve and label the intervals of increase and decrease. Mark the roots of the function and its intersection with the y-axis on the x-axis. Include a horizontal line segment below the graph to represent the function's domain. Add geometric elements like midpoints and line segments around the graph to illustrate geometric properties.
The prompt above was compiled from the original drawing commands and is for reference only.