
Comprehensive 3D Vector and Geometric Transformations (Figure 34)
Loading the math board and drawing, please wait…
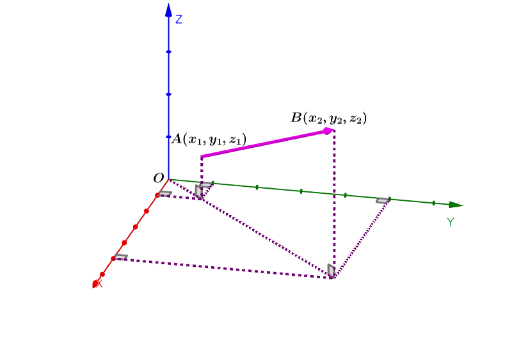
① This example demonstrates a comprehensive construction in 3D space involving vectors, segments, and angles, and their connections with conic sections (hyperbola, quadratic functions) and statistical characteristics. ② Core mathematical concepts include 3D vectors, vector operations, similar triangles, dilation (homothety), hyperbola and quadratic function graphs, and statistical measures represented geometrically. ③ Construction details: Uses GeoGebra commands Vector, Segment, and Angle; objects include points O, Q, P, A, B, C, D, E, F, vector u, lines f, g, h, j, i, k, l, m, n, p, q, and angles α, β, γ, δ, ε, ζ; multiple text objects (text1_1, text1_7, text1_8) label the construction, showing dynamic relationships between vectors and geometric figures. ④ Suitable for high school to early university mathematics education, useful for understanding the integration of 3D vectors, geometric transformations, and function graphs, and as a reference for dynamic GeoGebra demonstrations.
GeoGebra Commands & Parameters
Vector(P, Q) → uSegment(P, C) → fSegment(C, B) → gSegment(C, A) → hSegment(O, F) → jSegment(E, F) → iSegment(F, D) → kSegment(Q, F) → lAngle(Q, F, O) → αAngle(P, C, O) → βSegment(O, E) → mSegment(O, D) → nAngle(O, E, F) → γAngle(F, D, O) → δSegment(O, A) → pSegment(O, B) → qAngle(C, A, O) → εAngle(O, B, C) → ζ
AI Drawing Prompt Reference
Construct a comprehensive 3D figure involving vectors, line segments, and angles, demonstrating their connections with hyperbolas, quadratic function graphs, and statistical characteristics. Start by plotting a vector between points O and Q, then draw line segments connecting points P, C, B, A to O, and points E, F, D, Q to O. Label the angles between these segments as α, β, γ, δ, ε, ζ, and show how these elements relate to hyperbolas and quadratic function graphs.
The prompt above was compiled from the original drawing commands and is for reference only.