
Complex Limit Demonstration
Loading the math board and drawing, please wait…
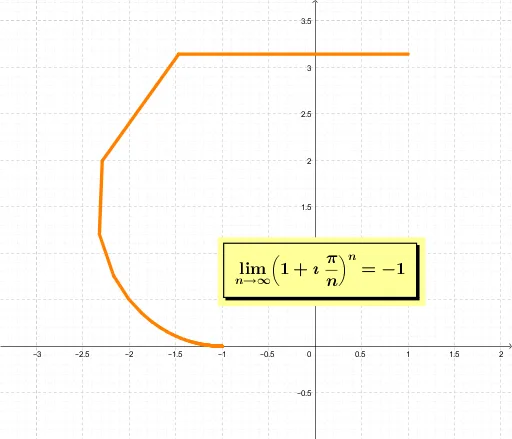
This example demonstrates the calculation and visualization of complex limits. It involves core mathematical concepts such as complex numbers, limits, sequences, and integral calculus. The construction uses GeoGebra commands like Sequence to generate sequences, with objects l1 and l2 representing sequence terms and texto1 displaying results. Suitable for high school and above mathematics learners to understand the geometric meaning and calculation methods of complex limits.
GeoGebra Commands & Parameters
Sequence((1 + (ί * π / n))^(n), n, 0, 10000) → l1Sequence(Segment[Element[l1, i], Element[l1, i + 1]], i, 2, 1000) → l2
AI Drawing Prompt Reference
Create a visualization demonstrating the calculation of complex limits, featuring a polyline generated by a sequence of complex numbers, composed of 1000 line segments connecting consecutive points in the sequence starting from the third point. The sequence is defined by (1 + (i * π / n))^(n) where n ranges from 0 to 10000, illustrating the geometric behavior and limit of the complex sequence.
The prompt above was compiled from the original drawing commands and is for reference only.