
Comparing Fractions Model: Cylinders and Riemann Sum Visualization
Loading the math board and drawing, please wait…
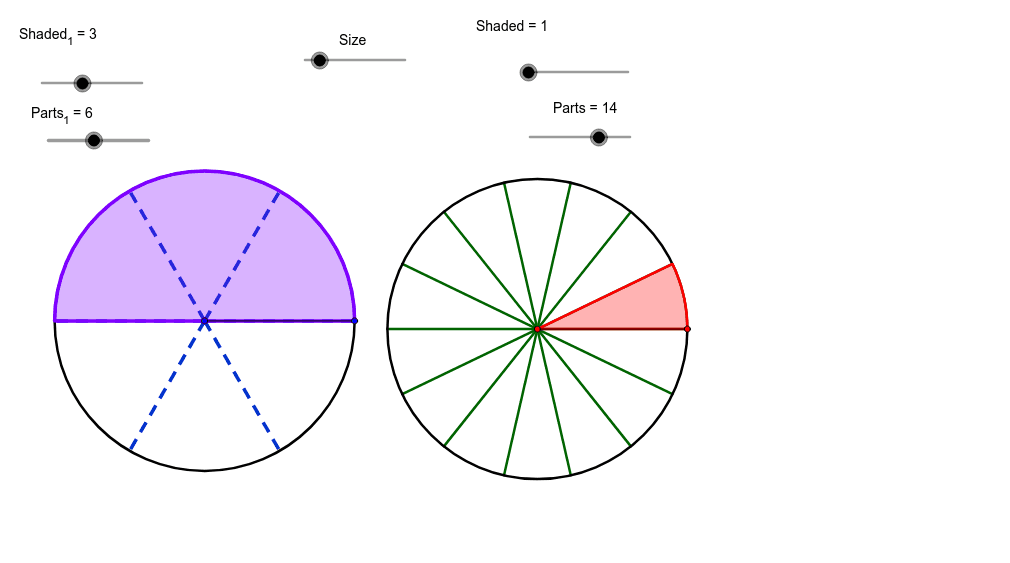
This GeoGebra example demonstrates fraction comparison using a combination of 3D cylinders and 2D shaded sectors. It visualizes how different fractions represent parts of a whole, linking the concept to area and volume. Core mathematical concepts include fractions, unit fractions, part-whole relationships, and the foundational idea of Riemann sums (upper and lower sums) as a precursor to integral calculus. The construction uses GeoGebra commands such as Circle, Point, Segment, Append, CircleSector, and Zip to create cylindrical sections and circular sectors. Objects like Parts_1, Size, ListP, Shaded_1, and Shade are used to manage multiple fraction parts and dynamically shade the corresponding regions. Sliders allow interactive adjustment of fraction values, making the comparison intuitive. This resource is suitable for upper elementary and middle school students learning fraction comparison, as well as high school students exploring the visual connection between fractions and Riemann sums in calculus. It effectively bridges geometric visualization with numerical concepts.
GeoGebra Commands & Parameters
Circle(A, Size) → cPoint(c) → BSegment(A, B) → aAppend(Sequence[Rotate[B, i, A], i, (360 / Parts_1)°, 359.9*°, (360 / Parts_1)°], Rotate[B, 359.99*°, A]) → ListPCircleSector(A, B, Element[ListP, Shaded_1]) → ShadeCircle(C, Size) → dPoint(d) → DAppend(Sequence[Rotate[D, s, C], s, (360 / Parts)°, 359.9*°, (360 / Parts)°], Rotate[D, 359.99*°, C]) → ListP2CircleSector(C, D, Element[ListP2, Shaded]) → Shade2Segment(C, D) → bZip(Segment[C, W], W, ListP2) → ListS2Zip(Segment[A, Z], Z, ListP) → ListS