
Compare Two Populations with Dot Plots
Loading the math board and drawing, please wait…
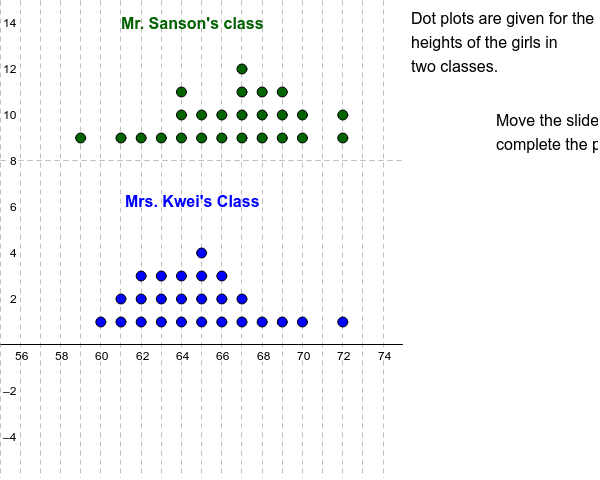
This example shows how to use dot plots to visually compare the distributions of two data sets. Core concepts include descriptive statistics (median, minimum, maximum), data visualization, and population comparison. Construction highlights: DotPlot creates the plots; Median, Min, Max compute summary statistics; Sequence and Join build the data lists; Translate, Segment, and Polygon assist layout and annotation; key objects are SansonList, SansonPlot, KweiList, KweiPlot, etc. Suitable for middle‑school statistics introduction, high‑school probability & statistics review, and classroom demonstrations.
GeoGebra Commands & Parameters
DotPlot(SansonList) → SansonPlotDotPlot(KweiList) → KweiPlotMedian(SansonList) → SMedMedian(KweiList) → KMedMin(SansonList) → SMinMax(SansonList) → SMaxMin(KweiList) → KMinMax(KweiList) → KMaxSequence(Sequence[Cell[1, i], j, 1, Cell[2, i]], i, 1, 14) → L1Join(L1) → L2Translate(SansonPlot, (0, 8)) → S2PlotSegment((KMin, 0), (KMin, 5)) → KMinSegSegment((KMax, 0), (KMax, 5)) → KMaxSegSegment((KMed, 0), (KMed, 5)) → KMedSegSegment((SMin, 8), (SMin, 13)) → SMinSegSegment((SMax, 8), (SMax, 13)) → SMaxSegSegment((SMed, 8), (SMed, 13)) → SMedSegPolygon((75, y(Corner[2])), Corner[2], Corner[3], (75, y(Corner[4]))) → Mask, a, b, c, d
AI Drawing Prompt Reference
Please draw two dot plots for two data sets. Each dot plot should contain points, line segments, and labels. The left dot plot represents the first data set, and the right dot plot represents the second data set. Below each dot plot, there should be labels for the minimum, maximum, and median. A vertical line segment should separate the left and right dot plots. Above each dot plot, there should be a rectangular area for labeling the data range. Ensure the graph is clear, labels are accurate, and the layout is symmetric.
The prompt above was compiled from the original drawing commands and is for reference only.