
Common Denominators (Rectangles)
Loading the math board and drawing, please wait…
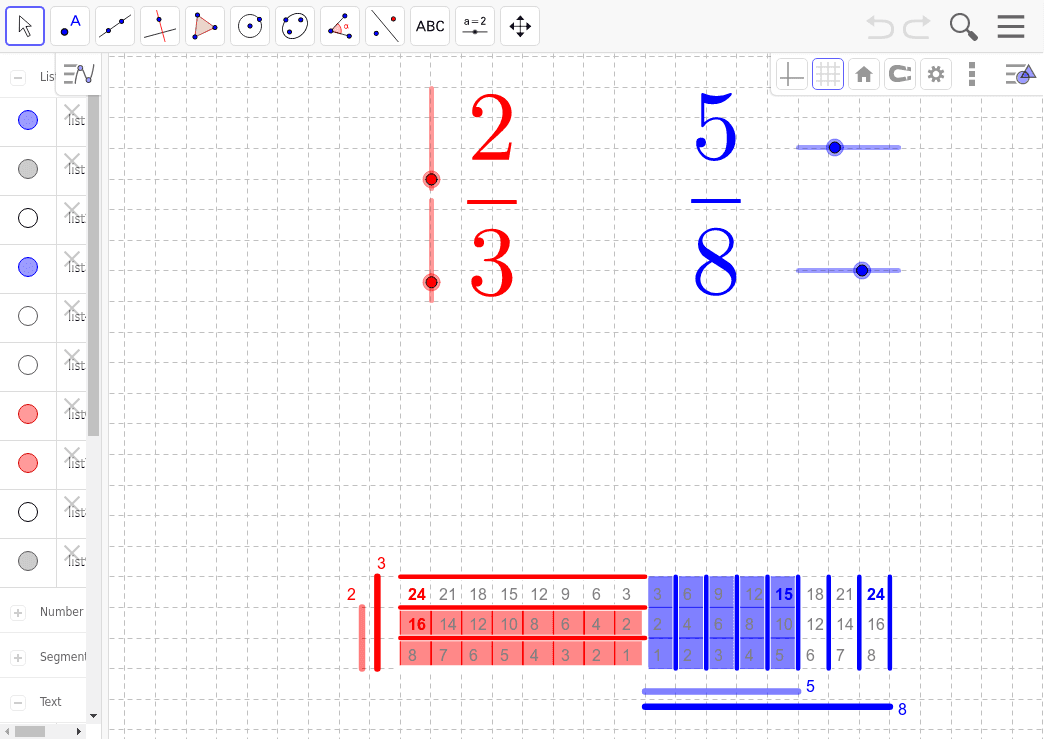
This example demonstrates the visualization of two fractions with common denominators by adjusting numbers. It helps in understanding fraction combination. Key math concepts include fractions, rectangles, and geometric construction. The construction uses GeoGebra commands like Sequence, Segment, and Text. Suitable for middle or high school math teaching to illustrate fraction operations visually.
GeoGebra Commands & Parameters
Sequence(Segment[(0, i), (d_2, i)], i, 1, d_1) → list2Sequence(Sequence[Polygon[(i - 1, j - 1), (i, j - 1), (i, j), (i - 1, j)], i, 1, n_2], j, 1, d_1) → list3Sequence(Segment[(i, 0), (i, d_1)], i, 1, d_2) → list1Sequence(Segment[(i, 0), (i, d_1)], i, 0, Max[d_2, n_2]) → list4Sequence(Segment[(0, i), ((-Max[d_2, n_2]), i)], i, 0, Max[d_1, n_1]) → list5Sequence(Sequence[Polygon[(1 - i, j - 1), ((-i), j - 1), ((-i), j), (1 - i, j)], j, 1, n_1], i, 1, d_2) → list6Sequence(Segment[(0, i), ((-d_2), i)], i, 1, d_1) → list7Sequence(Segment[((-i), 0), ((-i), d_1)], i, 1, d_2) → list8Sequence(Sequence[Text[(i * j), ((-i) + 0.25, j - 0.75)], i, 1, d_2], j, 1, Max[d_1, n_1]) → list9Sequence(Sequence[Text[(i * j), (j - 0.75, i - 0.75)], i, 1, d_1], j, 1, Max[d_2, n_2]) → list10Segment(((-d_2) - 0.75, 0), ((-d_2) - 0.75, d_1)) → aSegment(((-d_2) - 1.25, 0), ((-d_2) - 1.25, n_1)) → bText(n_1, ((-d_2) - 1.75, n_1 + 0.25)) → text3Text(d_1, ((-d_2) - 0.75, d_1 + 0.25)) → text4Segment((0, -0.75), (n_2, (-0.75))) → cSegment((0, -1.25), (d_2, (-1.25))) → dText(n_2, (n_2 + 0.25, (-0.75))) → text5Text(d_2, (d_2 + 0.25, (-1.5))) → text6Text((d_1 * d_2), ((-d_2) + 0.25, d_1 - 0.75)) → text8Text((n_1 * d_2), ((-d_2) + 0.25, n_1 - 0.75)) → text7Text((n_2 * d_1), (n_2 - 0.75, d_1 - 0.75)) → text9Text((d_2 * d_1), (d_2 - 0.75, d_1 - 0.75)) → text10
AI Drawing Prompt Reference
Visualize two fractions with common denominators using rectangles, adjustable with sliders to demonstrate fraction combination. Construct the visualization with multiple rectangular segments and text labels generated by sequence commands, starting with horizontal and vertical segments to form rectangles, then fill colors to represent fraction parts, and finally add text labels to show values and calculation results, presenting the geometric representation and combination process of fractions.
The prompt above was compiled from the original drawing commands and is for reference only.