
Combining Two Normal Distributions
Loading the math board and drawing, please wait…
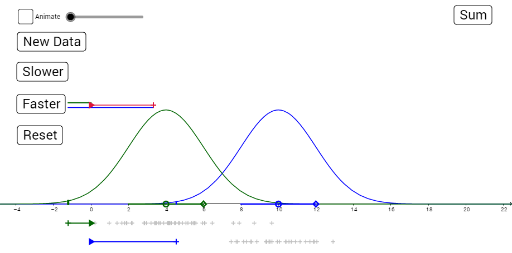
This example demonstrates the sampling process of X+/-Y where X and Y are both Normal random variables. It involves core math concepts like properties of normal distributions, linear combinations in probability statistics, and function graph overlays. GeoGebra commands such as Sort, Point, Zip, Segment, Translate, and Dilate are used to animate data distribution changes and visualize the impact of mean and standard deviation. Suitable for high school and above students learning probability statistics, mathematical statistics, and data analysis to understand the superposition characteristics of normal distributions.
GeoGebra Commands & Parameters
Sort(Sequence[RandomNormal[μ_1, σ_1], k, 1, N_1]) → data_1Sort(Sequence[RandomNormal[μ_2, σ_2], k, 1, N_2]) → data_2Point(yAxis) → O_2Point(yAxis) → O_1Zip((a, y(O_1)), a, data_1) → P_1Zip((a, y(O_2)), a, data_2) → P_2Point(yAxis) → O_3Segment(O_1, O_1 + (p_1, 0)) → bar_{p_1}Segment(O_2, O_2 + (x(picked_2), 0)) → bar_{p_2}Segment(control_{stdev1}, Mirror[control_{stdev1}, control_{mean1}]) → spread_1Segment(control_{stdev2}, Mirror[control_{stdev2}, control_{mean2}]) → spread_2Segment((p_3 + (ζ * (0.5 - random())), 1 + ε + painty(3, 0, p_3)), (p_3 + (ζ * (0.5 - random())), 1 + ε + painty(3, 1, p_3))) → painter_3Translate(bar_{p_1}, Vector[O_1, O_3 + (0, (0.25 * ε))]) → bar_{p_1}'Dilate(Translate[bar_{p_2}, Vector[O_2, O_3 - (0, (0.25 * ε))] + (p_1, 0)], sumOrDifference, O_3 + (p_1, (-0.25 * ε))) → bar_{p_2}'Segment(O_3, O_3 + (p_3, 0)) → bar_{p_3}Segment((p_2 + (ζ * (0.5 - random())), painty(2, (n_1 - 1) / (N_1 + 1), p_2)), (p_2 + (ζ * (0.5 - random())), painty(2, (n_1 + 1) / (N_1 + 1), p_2))) → painter_2Segment((p_1 + (ζ * (0.5 - random())), painty(1, (n_2 - 1) / (N_2 + 1), p_1)), (p_1 + (ζ * (0.5 - random())), painty(1, (n_2 + 1) / (N_2 + 1), p_1))) → painter_1Segment((p_2, painty(2, 0, p_2)), (p_2, painty(2, 1, p_2))) → paintmark_2Segment((p_1, painty(1, 0, p_1)), (p_1, painty(1, 1, p_1))) → paintmark_1
AI Drawing Prompt Reference
Visualize the superposition of two normal distributions, showing the sampling process of X+/-Y. Generate two sets of normal distribution data points, mark them on the coordinate axes, and represent their probability densities with bars. Adjust the mean and standard deviation with sliders to observe distribution changes. Finally, overlay the two datasets, using different colors and markers to display the combined effect and illustrate the superposition characteristics of normal distributions.
The prompt above was compiled from the original drawing commands and is for reference only.