
Complex Domain Coloring: Visualizing Complex Functions and Differential Equation
Loading the math board and drawing, please wait…
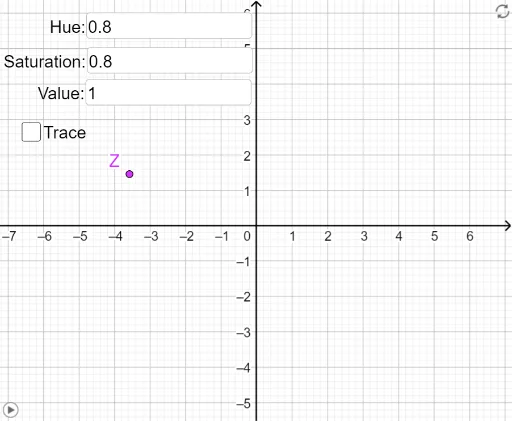
① This example demonstrates how to visualize complex-valued functions by coloring each point in the complex plane according to the function's value, making abstract complex analysis tangible. ② Core mathematical concepts include complex numbers, complex functions, differential equations, and 2D vector fields; the coloring encodes the modulus and argument of the complex output, revealing the function's behavior across the plane. ③ Construction highlights: using GeoGebra's Textfield and DynamicCoordinates commands to create interactive input boxes, defining objects R, Z, W, v, h, s, and a button (button1) to trigger dynamic updates, along with points A, a, B, C for parameter control, resulting in a dynamic colored domain plot. ④ Suitable for high school to university-level mathematics instruction, especially for complex analysis, differential equations, and visual mathematics, helping students grasp the geometric meaning of complex mappings.
GeoGebra Commands & Parameters
Textfield(W) → InputBox1Textfield(h) → InputBox2Textfield(s) → InputBox3Textfield(v) → InputBox4DynamicCoordinates(Z, x(Z), y(Z)) → ADynamicCoordinates(Z, x(Z), y(Z)) → C
AI Drawing Prompt Reference
Create a dynamic colored domain plot on the complex plane, where each point's color is determined by the value of a complex function at that point, with the coloring encoding both the modulus and argument of the complex output to reveal the function's behavior. Include four interactive text input fields for adjusting parameters such as the function expression, step size, and scaling, along with two dynamic coordinate points that update in real time based on a reference point on the plane, serving as parameter controls. The construction starts with the input fields and parameter points, then applies per-point coloring across the plane based on the function values, producing a continuously shaded region that refreshes dynamically with parameter changes, suitable for visualizing complex mappings and differential equation solutions.
The prompt above was compiled from the original drawing commands and is for reference only.