
Exploring Mean and Median by Andrew Knauft
Loading the math board and drawing, please wait…
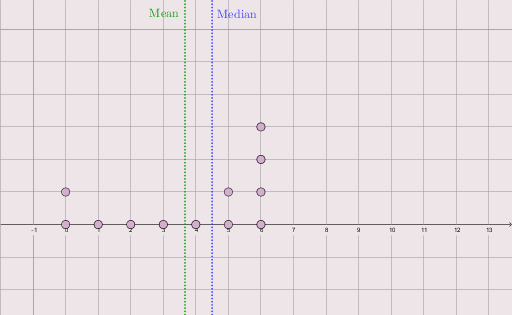
This example demonstrates the calculation and visualization of mean and median through dynamic coordinates. It involves core math concepts like mean, median, statistics, straight lines, hypothesis testing, correlation, and logarithmic functions. Construction highlights the use of GeoGebra commands/objects such as Point, DynamicCoordinates, and dynamic points A, D, C, B, E, F, G, H, I, J, K, L. Suitable for high school and above learners to understand data statistics and geometric relationships.
GeoGebra Commands & Parameters
Point(xAxis) → APoint(xAxis) → DPoint(xAxis) → CPoint(xAxis) → BPoint(xAxis) → EPoint(xAxis) → FPoint(xAxis) → GPoint(xAxis) → HPoint(xAxis) → IPoint(xAxis) → JPoint(xAxis) → KPoint(xAxis) → LDynamicCoordinates(A, x(A), CountIf[x(A) ≟ x(P), P, {B, C, D, E, F, G, H, I, J, K, L}]) → A_dDynamicCoordinates(B, x(B), CountIf[x(B) ≟ x(P), P, {C, D, E, F, G, H, I, J, K, L}]) → B_dDynamicCoordinates(C, x(C), CountIf[x(C) ≟ x(P), P, {D, E, F, G, H, I, J, K, L}]) → C_dDynamicCoordinates(D, x(D), CountIf[x(D) ≟ x(P), P, {E, F, G, H, I, J, K, L}]) → D_dDynamicCoordinates(E, x(E), CountIf[x(E) ≟ x(P), P, {F, G, H, I, J, K, L}]) → E_dDynamicCoordinates(F, x(F), CountIf[x(F) ≟ x(P), P, {G, H, I, J, K, L}]) → F_dDynamicCoordinates(G, x(G), CountIf[x(G) ≟ x(P), P, {H, I, J, K, L}]) → G_dDynamicCoordinates(H, x(H), CountIf[x(H) ≟ x(P), P, {I, J, K, L}]) → H_dDynamicCoordinates(I, x(I), CountIf[x(I) ≟ x(P), P, {J, K, L}]) → I_dDynamicCoordinates(J, x(J), CountIf[x(J) ≟ x(P), P, {K, L}]) → J_dDynamicCoordinates(K, x(K), CountIf[x(K) ≟ x(P), P, {L}]) → K_dDynamicCoordinates(L, x(L), 0) → L_d