
Coin Flipping Simulation: Frequency Statistics and Bar Chart Visualization
Loading the math board and drawing, please wait…
In collections
probability
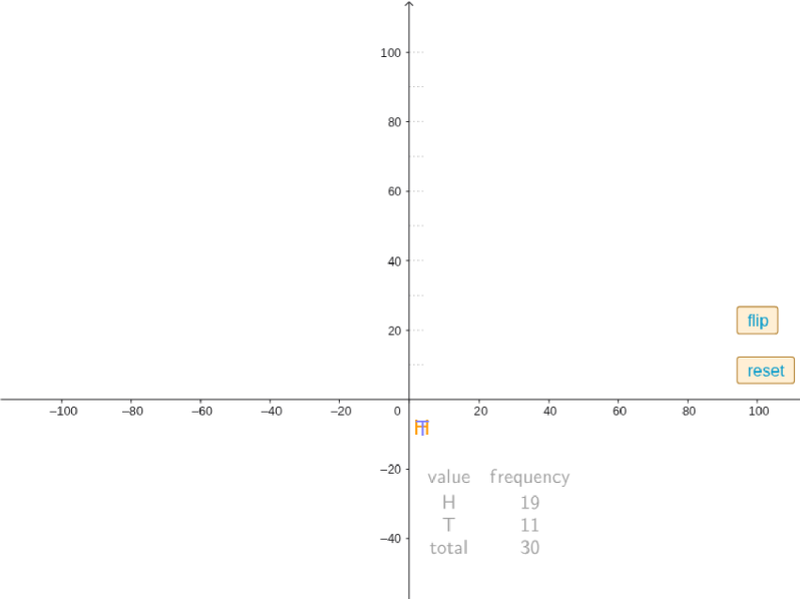
This GeoGebra example dynamically simulates coin flipping experiments, demonstrating how the relative frequency of outcomes approaches the theoretical probability as the number of trials increases. Core mathematical concepts include probability and statistics, frequency vs. probability, random experiments, counting, and data visualization. Construction highlights: uses CountIf to count heads/tails, If for conditional logic, TableText for data tables, Unique and Frequency for data distribution, Sequence for trial generation, and BarChart for frequency bar charts; buttons (button1/button2) control flipping and reset, slider (n) adjusts trial count, and text objects (text1/text2/text4) display real-time statistics. Suitable for middle and high school probability and statistics lessons, helping students understand the law of large numbers and random simulation methods, as well as exploring frequency stability.
GeoGebra Commands & Parameters
CountIf(x ≠ 0, trials) → nCountIf(x ≟ "H", trials) → HCountIf(x ≟ "T", trials) → TIf(n > 0, n, 1) → n1TableText({trials}) → text3Unique(trials) → list2Append("value", list2) → list3Frequency(trials) → list4Append("frequency", list4) → list5Append(list5, n) → list6Append(list3, "total") → list7TableText({list7, list6}, "cv") → text1Sequence(Segment[(0, i), (4, i)], i, 10, 100, 10) → list1BarChart(0.8, 1.5, {100 * CountIf[x ≟ "H", trials] / n1}) → cBarChart(1.5, 2.2, {100 * CountIf[x ≟ "T", trials] / n1}) → d
AI Drawing Prompt Reference
Create a statistical visualization of a coin-flipping experiment. On the left, show a dynamic table listing each trial outcome (heads or tails) with counts for heads, tails, and total trials. On the right, display two side-by-side bar charts representing the relative frequency (percentage) of heads and tails, with bar heights updating as trials increase. Include a slider above to adjust the number of trials, and two buttons for flipping and resetting. Add horizontal reference lines in the background to illustrate how frequencies approach 50% as trials grow.
The prompt above was compiled from the original drawing commands and is for reference only.