
Chaos in Hindu Square Root Method
Loading the math board and drawing, please wait…
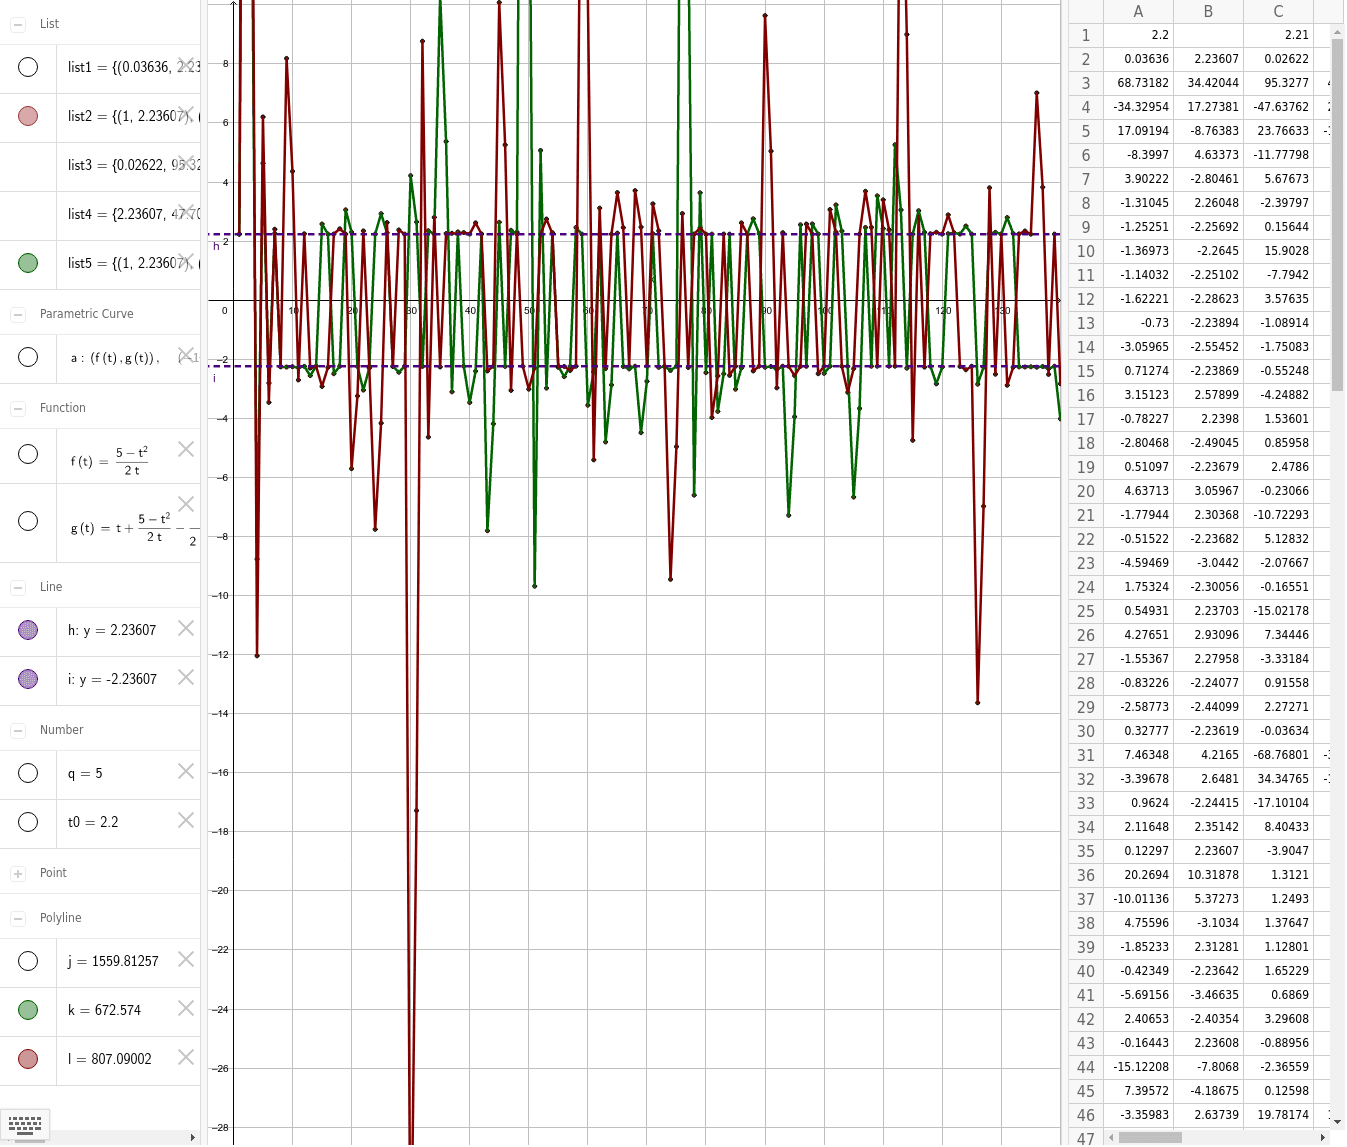
This example demonstrates the chaotic behavior in the Hindu square root method. It involves key mathematical concepts such as roots and square, as well as probability distribution. Using GeoGebra commands like CurveCartesian, PolyLine, and Sequence, a series of complex graphics are constructed. Suitable for high school mathematics education, particularly in calculus and probability & statistics courses.
GeoGebra Commands & Parameters
CurveCartesian((f(t), g(t)), t, -100, 100) → aPolyLine(list1) → jSequence((i, y(Element[list1, i])), i, 1, Length[list1], 1) → list2PolyLine(list2) → kSequence((i, Element[list4, i]), i, 1, Length[list4], 1) → list5PolyLine(list5) → l
AI Drawing Prompt Reference
Create a chaotic behavior graph demonstrating the irregularity of the Hindu square root method. First, draw a curve defined by functions f(t) and g(t), then use PolyLine to connect a series of points, generate a sequence where each element is a point on the curve, draw these points with PolyLine again, then generate another sequence where each element is a point from the previous sequence, and draw these points with PolyLine once more.
The prompt above was compiled from the original drawing commands and is for reference only.