
Center and Spread Exploration
Loading the math board and drawing, please wait…
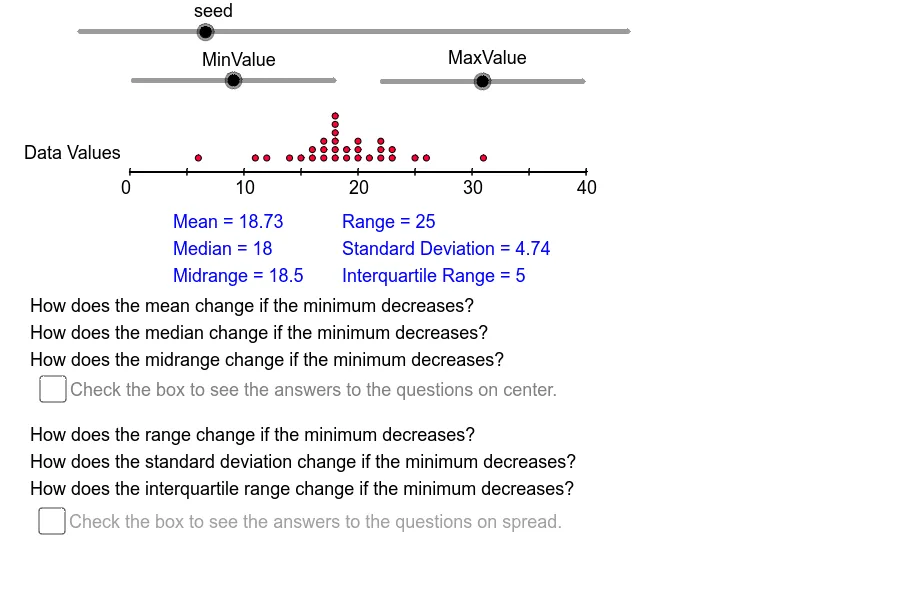
This example demonstrates the central tendency and spread of a dataset. Key mathematical concepts include mean, median, quartiles, and standard deviation. Using GeoGebra commands such as Mod, Sequence, and Mean, data sets can be constructed and their statistical properties analyzed. Suitable for statistics and data analysis courses.
GeoGebra Commands & Parameters
Mod(10 + (37 * seed), 80) → Nmbr1Sequence(RandomPoisson[seed], k, 1, size) → Dt1Max(Dt1) → DtMx1Min(Dt1) → DtMn1Sequence(k, k, DtMn1 - 10, DtMx1 + 10) → DmnSequence(k, k, DtMn1, DtMx1) → DmnMdAppend(Append[Dt1, DtMn2], DtMx2) → Dt2Union(Intersection[Dt1, DmnMd], {DtMn2, DtMx2}) → DtExtSort(Intersection[Dmn, DtExt]) → RngCountIf(x < DtMx2 + 1, Rng) → RngCntSequence(CountIf[x ≟ Element[Rng, k], Dt2], k, 1, RngCnt) → FrqSqSegment(LE, RE) → haxisSequence((Element[Rng, k], Element[FrqSq, k]), k, 1, RngCnt) → Dts1Sequence(Sequence[(adp(Element[Rng, k]), 0.02 + (0.03 * j)), j, 1, Element[FrqSq, k]], k, 1, RngCnt) → Dts2Sequence(Segment[((k * AxScl), -0.01), ((k * AxScl), 0.01)], k, 0, AxRE - AxLE, 5) → HTcsSequence(Text[k, (adp(k) - 1, -0.08)], k, AxLE, AxRE, 10) → HAxLblIf(MinOrMax ≟ 1, "minimum", "maximum") → MnOrMxIf(DownOrUp ≟ 1, "decreases", "increases") → DnOrUpMean(Dt2) → DtAvgMedian(Dt2) → DtQ2Q1(Dt2) → DtQ1Q3(Dt2) → DtQ3SampleSD(Dt2) → DtSDIf(DownOrUp ≟ 1, "increases", "decreases") → UpOrDnIf(MinOrMax ≟ 1, If[DownOrUp ≟ 1, "increases", "decreases"], If[DownOrUp ≟ 1, "decreases", "increases"]) → SpCh
AI Drawing Prompt Reference
Create a statistical characteristics graph of a dataset, including the maximum, minimum, median, quartiles, and standard deviation. First, generate a random dataset, then find the maximum and minimum values of the dataset, next draw the range of the dataset, calculate and mark the median, quartiles, and standard deviation, and finally show the distribution of the data.
The prompt above was compiled from the original drawing commands and is for reference only.