
Cartesian Product of Real Intervals: A Visual Demonstration
Loading the math board and drawing, please wait…
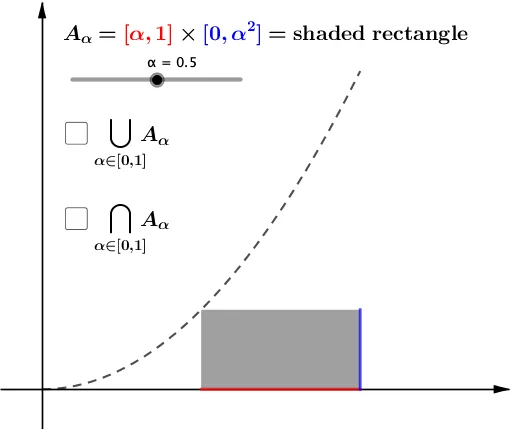
This GeoGebra example visually demonstrates the Cartesian product of real intervals, showing how the product of two intervals [a,b] and [c,d] forms a rectangular region in the plane, and extends to a cuboid in 3D space. It illustrates the fundamental set-theoretic concept of Cartesian products applied to real numbers, bridging abstract set theory with concrete geometric representation. The construction uses Segment commands to draw interval boundaries, CurveCartesian to trace parametric curves within the product region, and Integral to compute areas or volumes, quantifying the size of the product set. Key objects include α (an angle parameter), functions f and g, interval endpoints a, b, c, and text labels for annotations. This resource is ideal for high school and undergraduate mathematics, helping students grasp how set operations translate into geometry, and serving as a visual aid for introducing double integrals or volume calculations in calculus.
GeoGebra Commands & Parameters
Segment((α, 0), (1, 0)) → fSegment((1, 0), (1, α^(2))) → gCurveCartesian(t, t^(2), t, 0, 1) → bIntegral(x^(2), 0, 1) → c
AI Drawing Prompt Reference
Draw a Cartesian coordinate plane. Construct a horizontal line segment along the x-axis from 0 to 1)Skip, and a vertical line segment along the y-axis from 0 to 1. From the origin, draw a parabola y = x² for x between 0 and 1. Shade the region bounded by the parabola, the x-axis, the y-axis, and the two line segments. Label the area of this shaded region. The figure should clearly show the closed region and its area.
The prompt above was compiled from the original drawing commands and is for reference only.