
Candy Bar Measurement: Fractions and Coordinates Interactive
Loading the math board and drawing, please wait…
In collections
Candy Bars
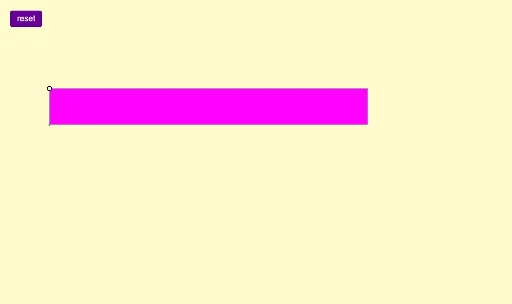
① This example uses a candy bar graphic to demonstrate measurement and comparison using fractions, coordinates, and line segments, with a touch of stochastic process for engagement. ② Core math concepts include fractions, coordinates, line segments, roots, integers, and an introduction to stochastic processes, ideal for understanding positions and lengths on a number line. ③ Construction highlights: The GeoGebra commands Polygon and Text are used to create the candy bar shape (poly1) and labels (text1), while Custom tools enable interactive elements like a reset button. Objects include points A, B, C, D, E, L, M through W, segments a, b, c, d, and auxiliary objects (q4, s, t, e, f_1 to r_1), forming a measurable geometric model. ④ Suitable for upper elementary to middle school students, this serves as a visual aid for teaching fractions and coordinates, and as an entry-level random simulation, allowing learners to grasp abstract concepts through hands-on interaction.
GeoGebra Commands & Parameters
Polygon(A, B, C, D) → poly1, a, b, c, dText("\frac{1}{12}", Centroid[poly1] + (-8, 0.75), true, true) → text1Custom(L) → q4, s, l_1, m_1, n_1, p_1, q_1, r_1, M, N, O, P, t, Q, R, S, T, U, V, W, e, f_1, g_1, h_1, i_1, j_1, k_1