
Boxplot Construction Example by GeoGebra Materials Team
Loading the math board and drawing, please wait…
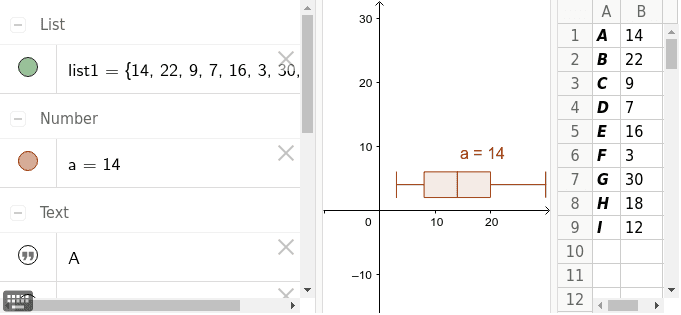
This example demonstrates how to create a boxplot using GeoGebra, visually representing data distribution characteristics. Core math concepts include probability & statistics on boxplots, data central tendency, and dispersion analysis. Construction highlights involve the GeoGebra command BoxPlot, utilizing objects A1-B9 and list1 data sources with parameter a. Suitable for high school and above mathematics education, particularly in probability statistics and data analysis courses.
GeoGebra Commands & Parameters
BoxPlot(4, 2, list1) → a
AI Drawing Prompt Reference
Draw a boxplot to visually represent data distribution characteristics, including four sets of data, each with two lines indicating the upper and lower quartiles, a rectangle showing the range from the median to the quartiles, and marked outliers, presenting the central tendency and dispersion of the data.
The prompt above was compiled from the original drawing commands and is for reference only.