
Normal Distribution by GeoGebra Materials Team
Loading the math board and drawing, please wait…
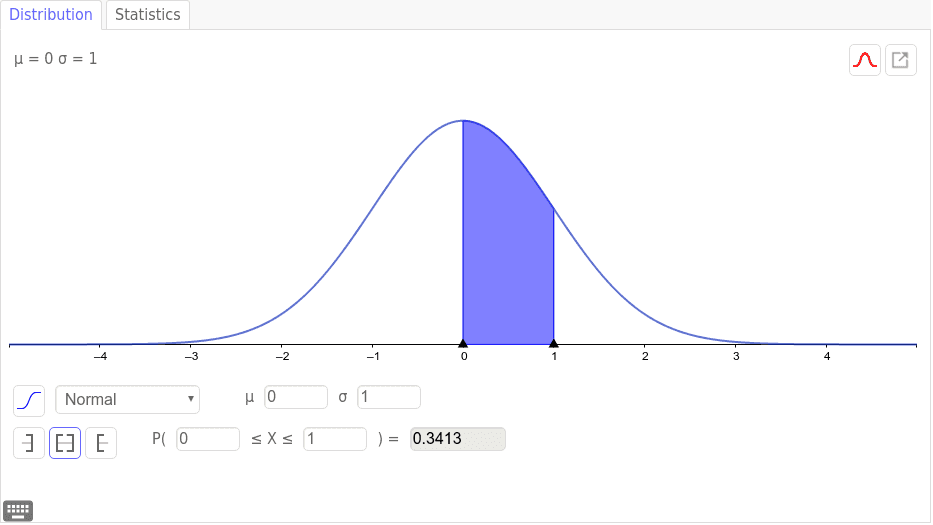
This example demonstrates the probability density function of the normal distribution and its properties, involving core concepts like probability & statistics, normal distribution, confidence interval, and optimization problems. It uses GeoGebra commands such as function graphing, slider animation, and parametric equations. Suitable for high school students and math enthusiasts learning probability statistics and data analysis.
AI Drawing Prompt Reference
Draw the probability density function of the normal distribution, showing its symmetry and peak, add sliders to dynamically adjust the mean and standard deviation, and plot confidence intervals and related curves for optimization problems to intuitively present core concepts in probability, statistics, and data analysis.
The prompt above was compiled from the original drawing commands and is for reference only.