
Scatter Plot and Best Fit Line by GeoGebra Materials Team
Loading the math board and drawing, please wait…
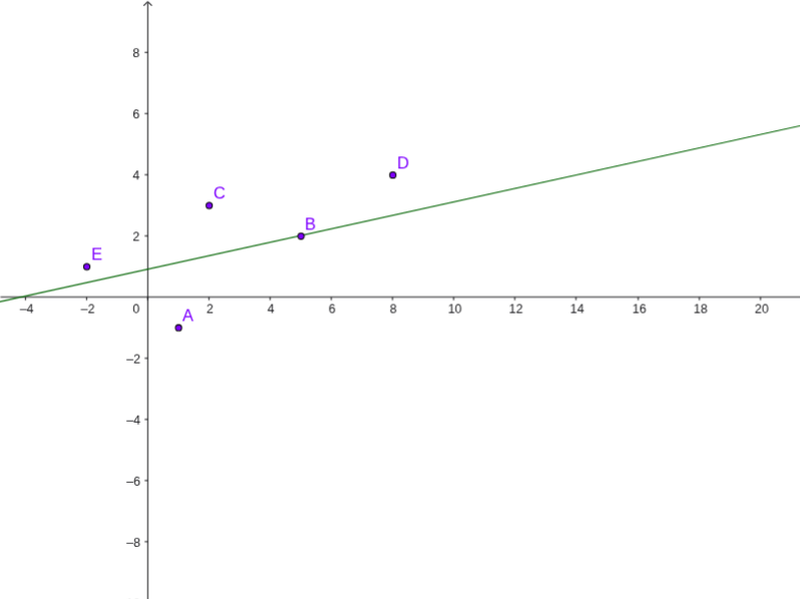
This example demonstrates how to create a scatter plot from data points and draw the best fit line using linear regression. Key math concepts include data analysis, linear regression, and coordinate geometry. The construction uses the GeoGebra command FitLineY to fit a line through the points A1-A5 and B1-B5, involving objects A, B, C, D, E, list1, and a. Suitable for high school mathematics teaching on data fitting and regression analysis.
GeoGebra Commands & Parameters
FitLineY({A, B, C, E}) → a
AI Drawing Prompt Reference
Create a scatter plot with two sets of data points, each containing five points, and fit a best fit line for each set using linear regression. The lines should connect the respective points, clearly showing the concept of linear regression. The plot should display both data points and the fitted lines, suitable for high school mathematics teaching on data fitting and regression analysis.
The prompt above was compiled from the original drawing commands and is for reference only.