
Bisection Method to Find a Real Root of an Equation
Loading the math board and drawing, please wait…
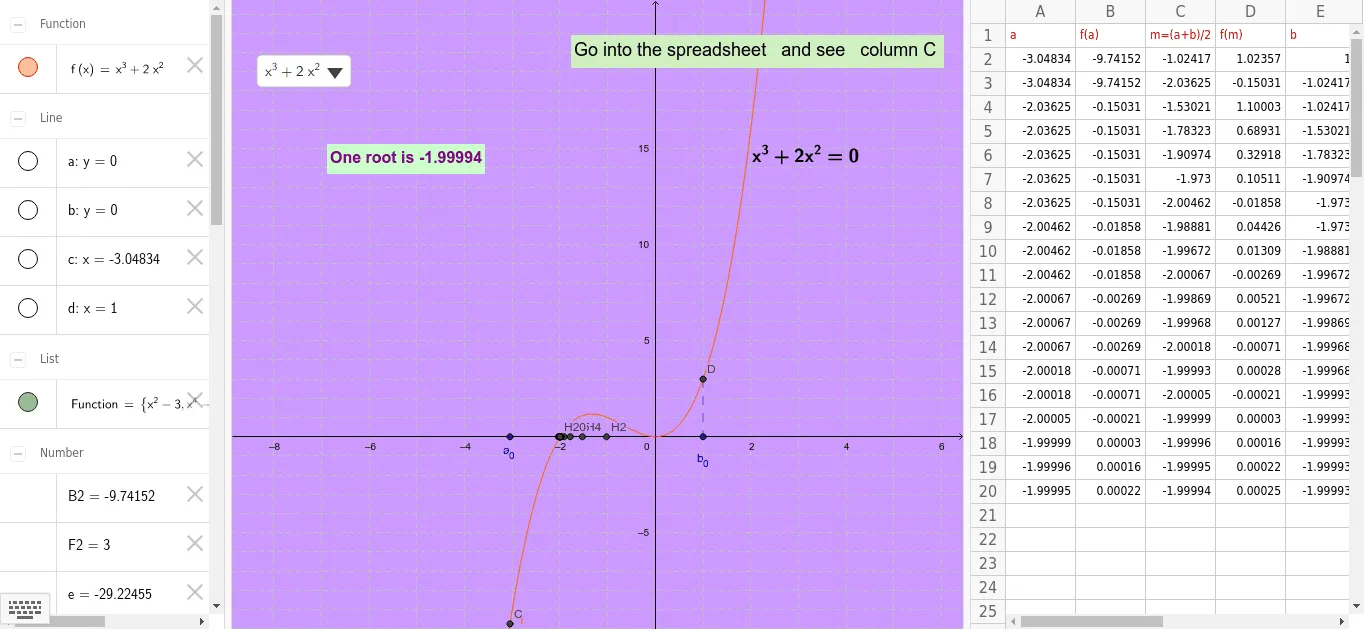
This example demonstrates the bisection method for finding a real root of an equation. Key mathematical concepts include functions, intervals, midpoints, and convergence. The construction involves functions, interval division, midpoint calculation, and iterative processes. GeoGebra commands used include Point, Line, Intersect, Segment, etc. Suitable for high school mathematics education and learning.
GeoGebra Commands & Parameters
Point(xAxis) → APoint(xAxis) → BSelectedElement(Function) → fIf((B2 * D2) < 0, true, false) → G2If(G2, A2, C2) → A3If(G2, C2, E2) → E3If((B3 * D3) < 0, true, false) → G3If(G3, A3, C3) → A4If(G3, C3, E3) → E4If((B4 * D4) < 0, true, false) → G4If(G4, A4, C4) → A5If(G4, C4, E4) → E5If((B5 * D5) < 0, true, false) → G5If(G5, A5, C5) → A6If(G5, C5, E5) → E6If((B6 * D6) < 0, true, false) → G6If(G6, A6, C6) → A7If(G6, C6, E6) → E7If((B7 * D7) < 0, true, false) → G7If(G7, A7, C7) → A8If(G7, C7, E7) → E8If((B8 * D8) < 0, true, false) → G8If(G8, A8, C8) → A9If(G8, C8, E8) → E9If((B9 * D9) < 0, true, false) → G9If(G9, A9, C9) → A10If(G9, C9, E9) → E10If((B10 * D10) < 0, true, false) → G10If(G10, A10, C10) → A11If(G10, C10, E10) → E11If((B11 * D11) < 0, true, false) → G11If(G11, A11, C11) → A12If(G11, C11, E11) → E12If((B12 * D12) < 0, true, false) → G12If(G12, A12, C12) → A13If(G12, C12, E12) → E13If((B13 * D13) < 0, true, false) → G13If(G13, A13, C13) → A14If(G13, C13, E13) → E14If((B14 * D14) < 0, true, false) → G14If(G14, A14, C14) → A15If(G14, C14, E14) → E15If((B15 * D15) < 0, true, false) → G15If(G15, A15, C15) → A16If(G15, C15, E15) → E16If((B16 * D16) < 0, true, false) → G16If(G16, A16, C16) → A17If(G16, C16, E16) → E17If((B17 * D17) < 0, true, false) → G17If(G17, A17, C17) → A18If(G17, C17, E17) → E18If((B18 * D18) < 0, true, false) → G18If(G18, A18, C18) → A19If(G18, C18, E18) → E19If((B19 * D19) < 0, true, false) → G19If(G19, A19, C19) → A20If(G19, C19, E19) → E20If((B20 * D20) < 0, true, false) → G20Line(A, xAxis) → aLine(A, a) → bOrthogonalLine(A, b) → cOrthogonalLine(B, b) → dIntersect(f, c) → CIntersect(f, d) → DSegment(D, B) → gText(f) → text2If(e > 0, text4, text1) → text5
AI Drawing Prompt Reference
Draw a function graph to find its intersection with the x-axis. Start by selecting two points A and B on the x-axis, then iteratively narrow down the interval containing the intersection by taking the midpoint of the current interval. If the function value at the midpoint and at point B have opposite signs, the new interval is the midpoint and B; otherwise, it's the midpoint and A. Repeat this process until the interval is sufficiently small.
The prompt above was compiled from the original drawing commands and is for reference only.