
Bisection Method to Find Real Roots of an Equation by Zero Neto
Loading the math board and drawing, please wait…
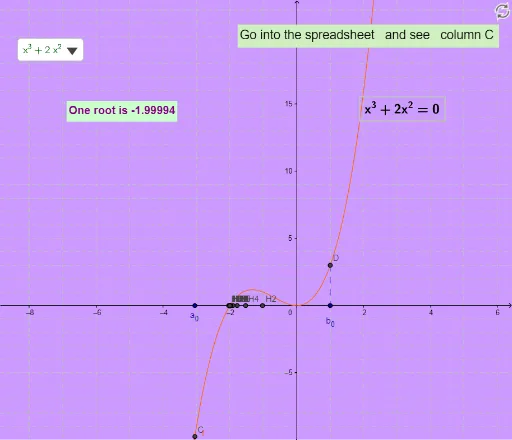
This example demonstrates the bisection method for finding real roots of an equation. Key mathematical concepts include functions, intervals, midpoints, and iteration. Using GeoGebra commands such as Point, Line, Intersect, etc., the process of the bisection method is dynamically illustrated. Suitable for high school mathematics education and learning.
GeoGebra Commands & Parameters
Point(xAxis) → APoint(xAxis) → BSelectedElement(Function) → fIf((B2 * D2) < 0, true, false) → G2If(G2, A2, C2) → A3If(G2, C2, E2) → E3If((B3 * D3) < 0, true, false) → G3If(G3, A3, C3) → A4If(G3, C3, E3) → E4If((B4 * D4) < 0, true, false) → G4If(G4, A4, C4) → A5If(G4, C4, E4) → E5If((B5 * D5) < 0, true, false) → G5If(G5, A5, C5) → A6If(G5, C5, E5) → E6If((B6 * D6) < 0, true, false) → G6If(G6, A6, C6) → A7If(G6, C6, E6) → E7If((B7 * D7) < 0, true, false) → G7If(G7, A7, C7) → A8If(G7, C7, E7) → E8If((B8 * D8) < 0, true, false) → G8If(G8, A8, C8) → A9If(G8, C8, E8) → E9If((B9 * D9) < 0, true, false) → G9If(G9, A9, C9) → A10If(G9, C9, E9) → E10If((B10 * D10) < 0, true, false) → G10If(G10, A10, C10) → A11If(G10, C10, E10) → E11If((B11 * D11) < 0, true, false) → G11If(G11, A11, C11) → A12If(G11, C11, E11) → E12If((B12 * D12) < 0, true, false) → G12If(G12, A12, C12) → A13If(G12, C12, E12) → E13If((B13 * D13) < 0, true, false) → G13If(G13, A13, C13) → A14If(G13, C13, E13) → E14If((B14 * D14) < 0, true, false) → G14If(G14, A14, C14) → A15If(G14, C14, E14) → E15If((B15 * D15) < 0, true, false) → G15If(G15, A15, C15) → A16If(G15, C15, E15) → E16If((B16 * D16) < 0, true, false) → G16If(G16, A16, C16) → A17If(G16, C16, E16) → E17If((B17 * D17) < 0, true, false) → G17If(G17, A17, C17) → A18If(G17, C17, E17) → E18If((B18 * D18) < 0, true, false) → G18If(G18, A18, C18) → A19If(G18, C18, E18) → E19If((B19 * D19) < 0, true, false) → G19If(G19, A19, C19) → A20If(G19, C19, E19) → E20If((B20 * D20) < 0, true, false) → G20Line(A, xAxis) → aLine(A, a) → bOrthogonalLine(A, b) → cOrthogonalLine(B, b) → dIntersect(f, c) → CIntersect(f, d) → DSegment(D, B) → gText(f) → text2If(e > 0, text4, text1) → text5
AI Drawing Prompt Reference
Draw a function graph, define an interval [A, B], repeatedly find the midpoint within the interval, check the sign of the product between the midpoint and the endpoints, and narrow down the interval based on the sign change until a point near the zero is found. Draw the function curve f(x) and the midpoints and endpoints of the interval at each iteration.
The prompt above was compiled from the original drawing commands and is for reference only.