
Binomial Distribution with Normal Approximation Demo
Loading the math board and drawing, please wait…
In collections
Statistical Applets
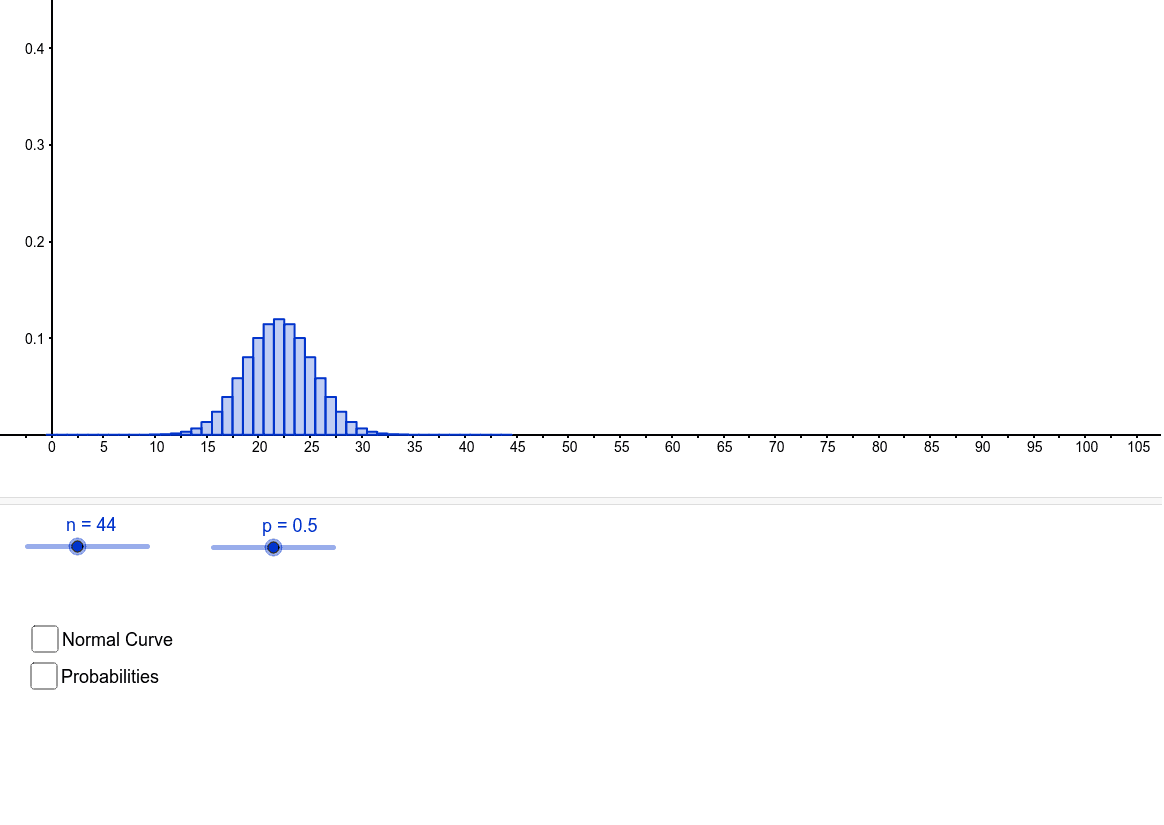
Explore the binomial distribution and its normal approximation by adjusting parameters with sliders. Compare the binomial curve to the normal distribution curve. This example uses GeoGebra commands like Point, BinomialDist, Normal, and Integral to construct the distributions, calculate mean, standard deviation, and probabilities, demonstrating the approximation theorem. Ideal for high school and above in probability and statistics education.
GeoGebra Commands & Parameters
Point(xAxis) → BPoint(xAxis) → ABinomialDist(n, p) → aNormal(mean, sd, x) → fBinomialDist(n, p, CB, true) → PBBinomialDist(n, p, CA - 1, true) → PAIntegral(f, x(A), x(B)) → b
AI Drawing Prompt Reference
Create a graph comparing a binomial distribution and a normal distribution, with both curves adjustable via sliders. Mark the mean and standard deviation on the horizontal axis, and calculate probabilities for intervals in both distributions to demonstrate the normal approximation of the binomial.
The prompt above was compiled from the original drawing commands and is for reference only.