
Binomial Distribution Probability Calculator
Loading the math board and drawing, please wait…
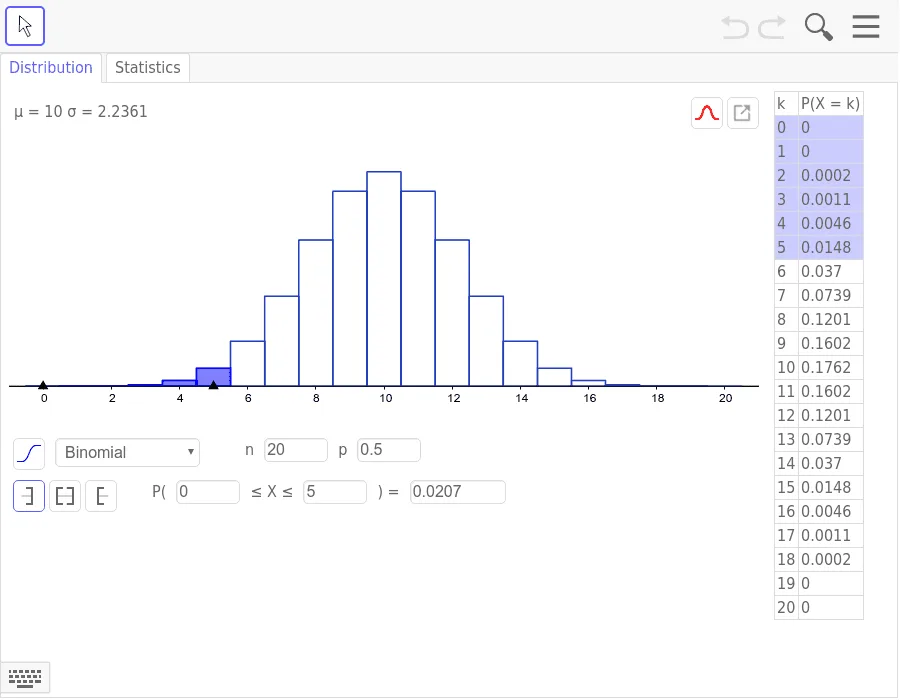
This example demonstrates how to use GeoGebra to plot the probability mass function of a binomial distribution. Core mathematical concepts include binomial distribution, probability calculation, bar chart, and sequence. Key GeoGebra commands and objects used are BinomialDist (binomial distribution), BarChart (bar chart), Sequence (sequence), Min (minimum), Max (maximum), and objects n (trials), p (success probability), text1, k (random variable), b (bar chart data), a (range), text2, A (result), and c (construction aid). Suitable for high school and above students to learn and understand the characteristics of binomial distribution in probability and statistics.
GeoGebra Commands & Parameters
BinomialDist(n, p, k, true) → bBinomialDist(n, p) → aBarChart(-0.5, n + 0.5, Sequence[((Binomial[n, k] * p^(k)) * (1 - p)^(n - k)), k, 0, n, 1]) → cSequence(20, 20, 0, 20) →Min(x(Point[xAxis]) + 1.5, x(Point[xAxis]) + 1.5) →Max(x(Point[xAxis]) + 1.5, x(Point[xAxis]) + 1.5) →
AI Drawing Prompt Reference
Create a bar chart illustrating the probability mass function of a binomial distribution. The x-axis represents the number of successes from 0 to n, and the y-axis shows the corresponding probabilities. Draw adjacent bars for each integer value, spanning from -0.5 to n+0.5. Overlay a smooth cumulative distribution curve. Include sliders to adjust the number of trials n and success probability p, and display the probability for a chosen k value as text. This visual helps explore how the distribution shape changes with parameters.
The prompt above was compiled from the original drawing commands and is for reference only.