
Binomial Distribution by Dr Brooks
Loading the math board and drawing, please wait…
In collections
statistics
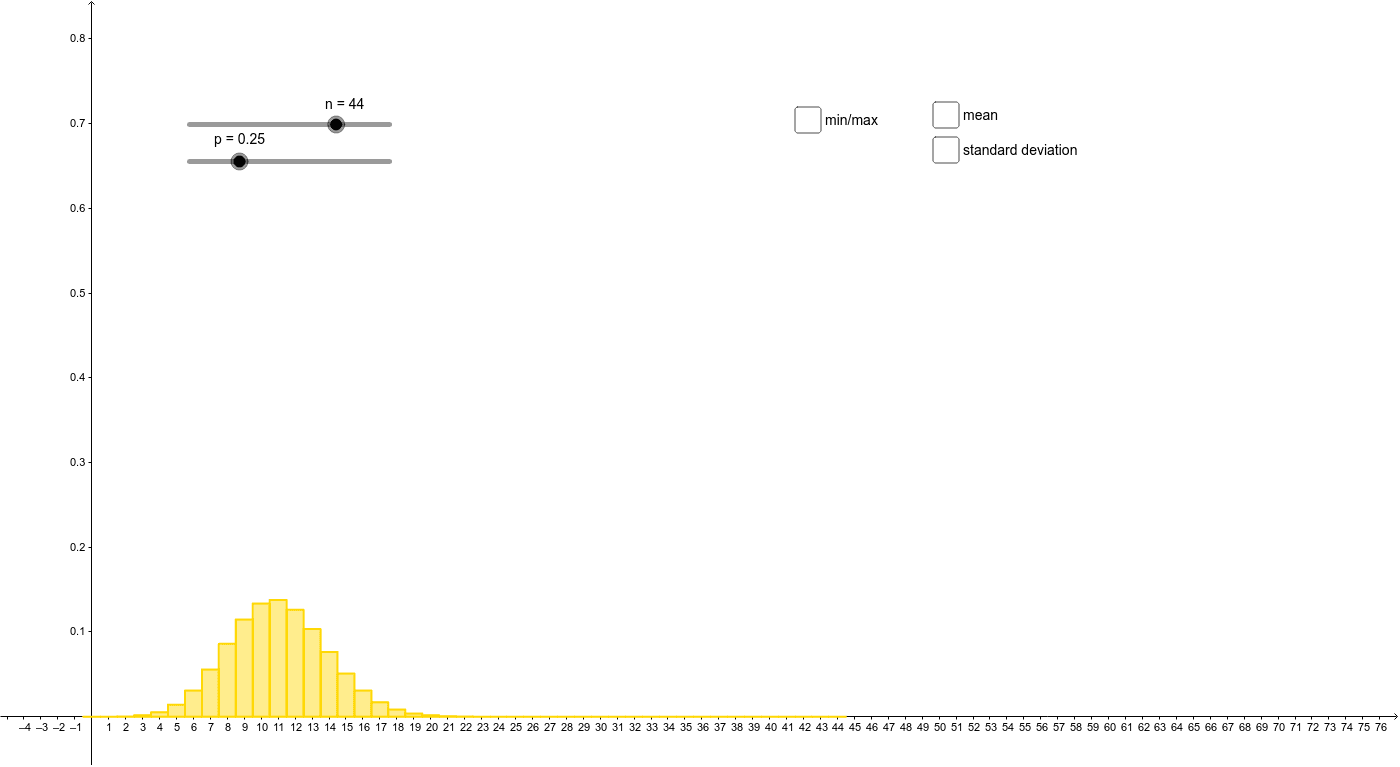
This example demonstrates the graph and characteristics of the binomial distribution, a discrete probability distribution used to describe the probability of a certain number of successes in a fixed number of independent trials. By adjusting the number of trials n and the success probability p, you can observe how the distribution changes. Commands used include Binomial, BinomialDist, and BarChart, suitable for high school mathematics and statistics courses.
GeoGebra Commands & Parameters
Binomial(60, 0.3) → aBinomialDist(60, 0.3, 20, true) → cBinomialDist(n, p) → bBarChart((-0.5) + min, 0.5 + max, Sequence[((Binomial[n, k] * p^(k)) * (1 - p)^(n - k)), k, min, max]) → d
AI Drawing Prompt Reference
Draw a binomial distribution with 60 trials and a success probability of 0.3. Adjust the number of trials and success probability to observe changes in the distribution. Use a bar chart to show the probability of different numbers of successes from 0 to 60 trials.
The prompt above was compiled from the original drawing commands and is for reference only.