
Binomial and Normal Distribution by Malin Christersson
Loading the math board and drawing, please wait…
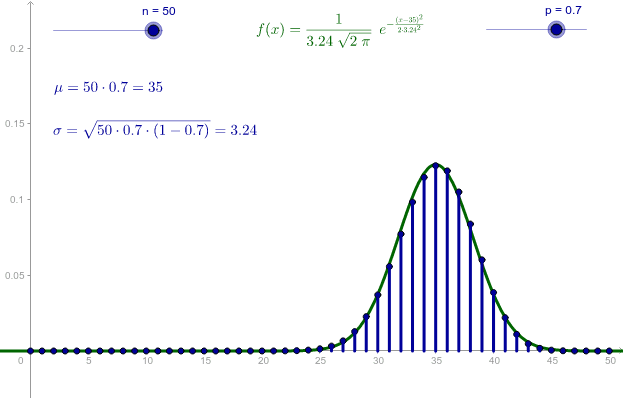
This example demonstrates the graphical changes and relationship between binomial and normal distributions via interactive sliders. Core math concepts include probability statistics, distribution functions, mean, and variance. GeoGebra commands used are Sequence, n, p, s, points, segments, mu, sig, f, and text elements. Suitable for high school students and teachers for probability statistics education and exploration.
GeoGebra Commands & Parameters
Sequence(((Binomial[n, k] * p^(k)) * (1 - p)^(n - k)), k, 0, n) → sSequence((i, Element[s, i + 1]), i, 0, n) → pointsSequence(Segment[Element[points, i + 1], (i, 0)], i, 0, n) → segments
AI Drawing Prompt Reference
Demonstrate the relationship between binomial and normal distributions using interactive sliders, showing the binomial distribution as a bar graph with connected points and the normal distribution curve, allowing adjustments to see how the distributions change and relate, suitable for probability statistics education and exploration.
The prompt above was compiled from the original drawing commands and is for reference only.