
Bee Pollen Collection: Greedy Algorithm Visualization
Loading the math board and drawing, please wait…
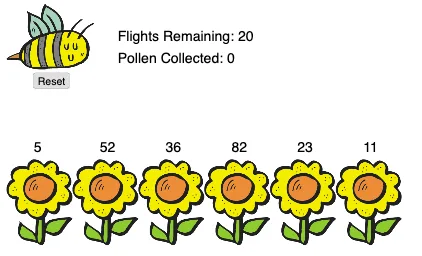
This GeoGebra example dynamically simulates a bee collecting pollen from multiple flowers, visually demonstrating how a greedy algorithm succeeds in path selection problems. The core mathematical concepts include optimization problems, distance calculations in plane geometry, trigonometric functions (used to model the bee's flight direction and angles), and complex numbers (possibly for representing flower positions or rotations). Construction highlights: Text commands create labels (text1 to text9), multiple flower objects (pollenFlower1 to pollenFlower6) and a bee object are defined, buttons/sliders (collect, Reset) control the process, and variables totalPollen and numFlights track total pollen and flight count. This example is suitable for high school or university students learning algorithms combined with geometry, and also useful for mathematical modeling or introductory computer science courses to intuitively understand greedy strategies in real-world scenarios.
GeoGebra Commands & Parameters
Text(pollenFlower1) → text1Text(pollenFlower2) → text2Text(pollenFlower3) → text3Text(pollenFlower4) → text4Text(pollenFlower5) → text5Text(pollenFlower6) → text6