
Bar Chart for Classroom Strength: Visualization and Activity Design
Loading the math board and drawing, please wait…
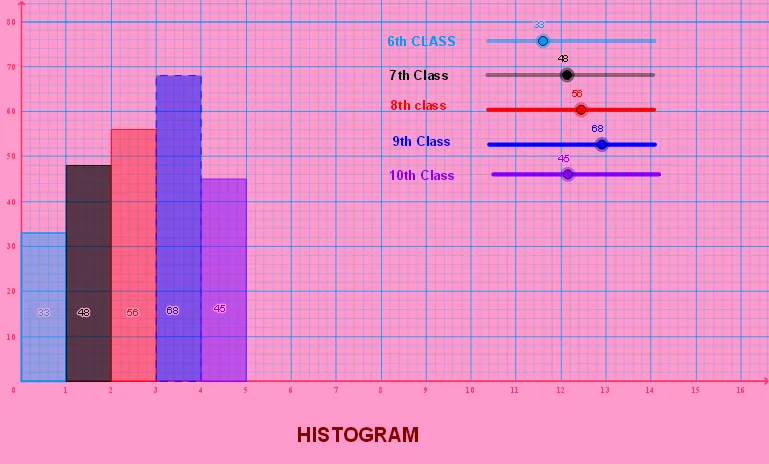
This example demonstrates how to use bar charts to visualize student learning intensity in a classroom and design corresponding activities. Key mathematical concepts include data visualization, statistical distribution, and geometric representation. Construction involves using Histogram command, axis settings, and text annotations with GeoGebra objects. Suitable for middle school students for statistics education and classroom management.
GeoGebra Commands & Parameters
Histogram({0, 1}, {a}) → fHistogram({1, 2}, {b}) → gHistogram({2, 3}, {c}) → hHistogram({3, 4}, {d}) → iHistogram({4, 5}, {e}) → j
AI Drawing Prompt Reference
Create a bar chart to visualize student learning intensity in a class. Start by drawing a bar chart for the 0-1 score range, then 1-2, 2-3, 3-4, and finally 4-5 score ranges. Set the x-axis as the score intervals and the y-axis as the number of students. Add text annotations to explain which score range each bar chart represents.
The prompt above was compiled from the original drawing commands and is for reference only.