
Assessment Form of Quadratic and Cubic Polynomials
Loading the math board and drawing, please wait…
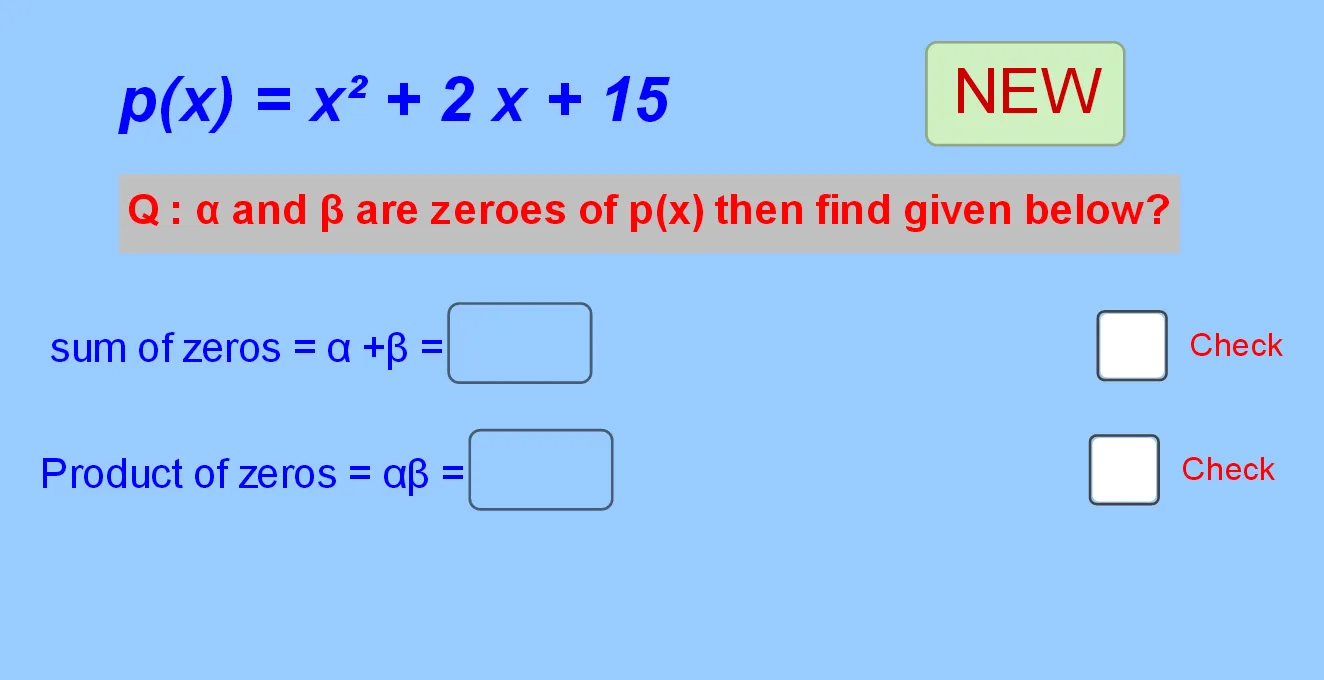
This example uses randomly generated quadratic and cubic polynomials to help students understand the properties and graphical characteristics of polynomials. Key mathematical concepts include polynomial functions, function graphs, and logical reasoning. Using GeoGebra commands such as Random, Textfield, and If, students can dynamically explore how the coefficients of polynomials affect their graphs. Suitable for high school mathematics education and learning.
GeoGebra Commands & Parameters
Random(-10, 10) → bRandom(-20, 20) → cRandom(-30, 30) → dTextfield(a1) → InputBox1If(a1 ≟ sum1, "Correct", "No, Try again") → text2Textfield(b1) → InputBox2If(b1 ≟ pro1, "Correct", "No, Try again") → text3Textfield(a2) → InputBox3Textfield(b2) → InputBox4Textfield(c2) → InputBox5If(a2 ≟ sum1, "Correct", "NO try again") → text7If(b2 ≟ pro1, "Correct", "NO try again") → text8If(c2 ≟ pro2, "Correct", "NO try again") → text9
AI Drawing Prompt Reference
Create an interactive assessment graphic for quadratic and cubic polynomials. Randomly generate the coefficients for the polynomial expressions and provide input boxes where students enter candidate values. Include a feedback text area that uses logical checking: if the entered value matches the corresponding target coefficient-derived quantity, display “Correct”; otherwise display “No, Try again.” The graphic should present polynomial functions and their function graphs, emphasizing how changing coefficients affects the curves. Build it by first generating the random coefficients, then adding the input fields and the linked correctness messages, and finally showing the polynomial graphs connected to those coefficient inputs.
The prompt above was compiled from the original drawing commands and is for reference only.