
Interactive Histogram Construction Tutorial
Loading the math board and drawing, please wait…
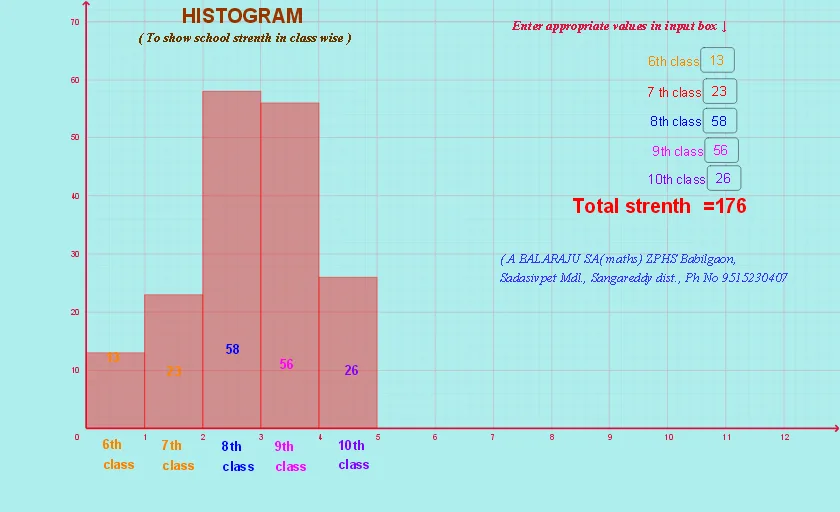
This GeoGebra example demonstrates how to create an interactive histogram using the Histogram command. Users can input data through five InputBoxes, with Textfields providing labels and a slider controlling display parameters. The core mathematical concepts include grouped data statistics, frequency calculation, and the correspondence between bar height and frequency. Construction highlights: Histogram command for rendering, InputBox1-5 for data input, text1-15 for axis labels and legends, slider for controlling bin width or display range. Suitable for middle school statistics teaching, introductory probability courses, and data visualization practice.
GeoGebra Commands & Parameters
Textfield(a) → InputBox1Textfield(b) → InputBox2Textfield(c) → InputBox3Textfield(d) → InputBox4Textfield(e) → InputBox5Histogram({0, 1, 2, 3, 4, 5}, {a, b, c, d, e}) → f
AI Drawing Prompt Reference
Create an interactive histogram. Use a horizontal axis from 0 to 5, and represent frequency by the height of each bar. Provide five input boxes where the user can enter values a, b, c, d, and e; the histogram should compute grouped-data frequencies from these inputs and update the bar heights accordingly. Include text labels for the axis and legend, and add a slider to control a display parameter such as bin width or the shown range so the histogram changes as the slider moves.
The prompt above was compiled from the original drawing commands and is for reference only.