
Average Rate of Change of a Function Quiz
Loading the math board and drawing, please wait…
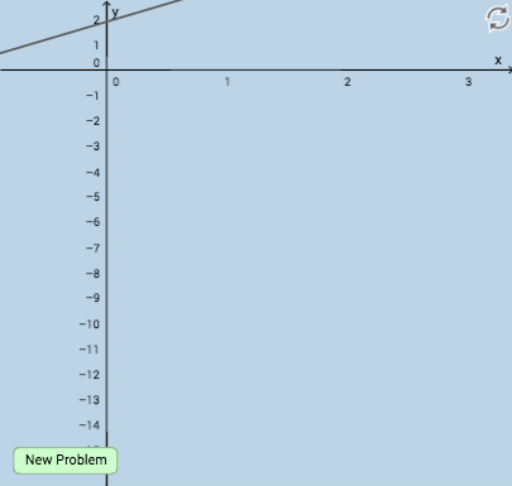
This example demonstrates how to calculate the average rate of change of a function over a given interval. Key mathematical concepts include functions, average rate of change, and slope. Using GeoGebra commands such as Random, Sequence, and Slope, it generates practice questions with feedback. Suitable for high school math education and learning.
GeoGebra Commands & Parameters
Random(1, 3) → nSequence(i, i, -2, 2, 0.1) → alistRandomElement(alist) → aRandomElement(blist) → bSequence(i, i, -2, 1.8, 0.1) → clistRandomElement(clist) → cRandomElement(mlist) → mRandomElement(clist) → startSequence(i, i, start + 0.2, 2, 0.1) → endlistRandomElement(endlist) → endSlope(f) → ans1FractionText(ans1) → text1FractionText(ans2) → text2FractionText(ans3) → text3Polygon(A, G, B) → poly1, b_1, a_1, g_1Segment(B, G) → iSegment(G, A) → jPolygon(C, H, D) → poly2, d, c_1, h_1Segment(C, H) → kSegment(H, D) → lPolygon(E, I, F) → poly3, f_1, e, i_1Segment(F, I) → pSegment(I, E) → qSegment(F, E) → rSegment(C, D) → sSlope(s) → m_1Slope(r) → m_2Slope(f) → m_3Textfield(o) → InputBox1Midpoint(C, D) → JMidpoint(A, B) → KMidpoint(E, F) → L