
Average Rate of Change: Graphing with a Secant Line
Loading the math board and drawing, please wait…
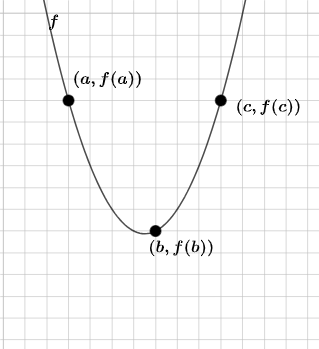
This example demonstrates how to visualize the average rate of change of a function by picking two points on the graph, connecting them with a secant line, and interpreting the secant’s slope as the difference quotient. It centers on key calculus ideas: average rate of change, the difference quotient (Δy/Δx), slope, and the geometric meaning of the secant line. Construction-wise, it uses GeoGebra commands such as Random/RandomElement to select points or parameters, Sequence to generate lists of x-values, PointIn to place points on the function graph, Line to draw the secant segment, and FitPoly where needed to support fitting/constructing the appropriate geometric curve or relation. Data objects like lists (e.g., nlist/dlist) store values used in computing Δy and Δx, while If and Union help manage conditional logic and combine constructions. FractionText is used to display the average rate of change as a fraction, alongside text objects for annotations. Suitable for students learning calculus (especially early derivative intuition) and for interactive graphing practice.
GeoGebra Commands & Parameters
PointIn(a) → BPointIn(b) → CFitPoly({A, B, C}) → fLine(A, B) → gLine(A, C) → hLine(B, C) → iRandom(1, 3) → cSequence(i, i, -9, 9, 1) → nlistFractionText(d) → text1If(c ≟ 1, text3, c ≟ 2, text4, c ≟ 3, text3) → firstIf(c ≟ 1, text4, c ≟ 2, text5, c ≟ 3, text5) → secondSequence(i, i, 1, c - 1, 1) → l2Sequence(i, i, c + 1, 3, 1) → l3Union(l2, l3) → l4RandomElement(l4) → nIf(n ≟ 1, text3, n ≟ 2, text4, n ≟ 3, text3) → newfirstIf(n ≟ 1, text4, n ≟ 2, text5, n ≟ 3, text5) → newsecondFractionText(d1) → text2
AI Drawing Prompt Reference
Draw a function graph and randomly select two points on it, connecting them with a line called a secant. Show the slope of the secant as the average rate of change of the function between these two points. Use a random number to choose the position of the secant and generate multiple x-value points with a sequence. Annotate the slope of the secant on the graph, distinguishing it from the function with different colors.
The prompt above was compiled from the original drawing commands and is for reference only.