
ATC Cobweb Diagram Example
Loading the math board and drawing, please wait…
In collections
ATC Cobwebs and Linear Difference Equations
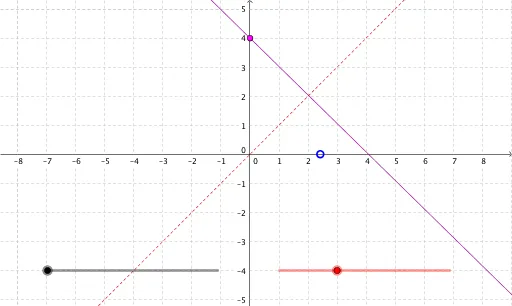
This example demonstrates the ATC cobweb diagram, a graphical method for analyzing the stability of nonlinear mappings. Key mathematical concepts include functions, iteration, and convergence. Using GeoGebra commands such as Point and Segment, the iterative process of the mapping is dynamically illustrated. Suitable for high school mathematics education and research.
GeoGebra Commands & Parameters
Point(yAxis) → BPoint(xAxis) → ASegment(A, (x(A), f(x(A)))) → cSegment((A1, A2), (A2, A2)) → B1Segment((A2, A2), (A2, A3)) → C1Segment((A2, A3), (A3, A3)) → B2Segment((A3, A3), (A3, A4)) → C2Segment((A3, A4), (A4, A4)) → B3Segment((A4, A4), (A4, A5)) → C3Segment((A4, A5), (A5, A5)) → B4Segment((A5, A5), (A5, A6)) → C4Segment((A5, A6), (A6, A6)) → B5Segment((A6, A6), (A6, A7)) → C5Segment((A6, A7), (A7, A7)) → B6Segment((A7, A7), (A7, A8)) → C6Segment((A7, A8), (A8, A8)) → B7Segment((A8, A8), (A8, A9)) → C7Segment((A8, A9), (A9, A9)) → B8Segment((A9, A9), (A9, A10)) → C8Segment((A9, A10), (A10, A10)) → B9Segment((A10, A10), (A10, A11)) → C9Segment((A10, A11), (A11, A11)) → B10Segment((A11, A11), (A11, A12)) → C10Segment((A11, A12), (A12, A12)) → B11Segment((A12, A12), (A12, A13)) → C11Segment((A12, A13), (A13, A13)) → B12Segment((A13, A13), (A13, A14)) → C12Segment((A13, A14), (A14, A14)) → B13Segment((A14, A14), (A14, A15)) → C13Segment((A14, A15), (A15, A15)) → B14Segment((A15, A15), (A15, A16)) → C14Segment((A15, A16), (A16, A16)) → B15Segment((A16, A16), (A16, A17)) → C15Segment((A16, A17), (A17, A17)) → B16Segment((A17, A17), (A17, A18)) → C16Segment((A17, A18), (A18, A18)) → B17Segment((A18, A18), (A18, A19)) → C17Segment((A18, A19), (A19, A19)) → B18Segment((A19, A19), (A19, A20)) → C18Segment((A19, A20), (A20, A20)) → B19Segment((A20, A20), (A20, A21)) → C19Segment((A20, A21), (A21, A21)) → B20Segment((A21, A21), (A21, A22)) → C20Segment((A21, A22), (A22, A22)) → B21Segment((A22, A22), (A22, A23)) → C21Segment((A22, A23), (A23, A23)) → B22Segment((A23, A23), (A23, A24)) → C22Segment((A23, A24), (A24, A24)) → B23Segment((A24, A24), (A24, A25)) → C23Segment((A24, A25), (A25, A25)) → B24Segment((A25, A25), (A25, A26)) → C24Segment((A25, A26), (A26, A26)) → B25Segment((A26, A26), (A26, A27)) → C25Segment((A26, A27), (A27, A27)) → B26Segment((A27, A27), (A27, A28)) → C26Segment((A27, A28), (A28, A28)) → B27Segment((A28, A28), (A28, A29)) → C27Segment((A28, A29), (A29, A29)) → B28Segment((A29, A29), (A29, A30)) → C28Segment((A29, A30), (A30, A30)) → B29Segment((A30, A30), (A30, A31)) → C29Segment((A30, A31), (A31, A31)) → B30Segment((A31, A31), (A31, A32)) → C30Segment((A31, A32), (A32, A32)) → B31Segment((A32, A32), (A32, A33)) → C31Segment((A32, A33), (A33, A33)) → B32Segment((A33, A33), (A33, A34)) → C32Segment((A33, A34), (A34, A34)) → B33Segment((A34, A34), (A34, A35)) → C33Segment((A34, A35), (A35, A35)) → B34Segment((A35, A35), (A35, A36)) → C34Segment((A35, A36), (A36, A36)) → B35Segment((A36, A36), (A36, A37)) → C35Segment((A36, A37), (A37, A37)) → B36Segment((A37, A37), (A37, A38)) → C36Segment((A37, A38), (A38, A38)) → B37Segment((A38, A38), (A38, A39)) → C37Segment((A38, A39), (A39, A39)) → B38Segment((A39, A39), (A39, A40)) → C38
AI Drawing Prompt Reference
Draw a cobweb diagram on a coordinate plane to illustrate the iteration of a nonlinear mapping. Start with two initial points on the axes, one on the y-axis and one on the x-axis. From the x-axis point, draw a vertical segment to the function curve, then a horizontal segment to the line y=x, and repeat this alternating pattern to create a staircase of segments. These segments gradually approach the intersection of the curve and the diagonal, showing convergence. Include the function curve, the diagonal line, coordinate axes, and multiple vertical and horizontal segments forming a clear web-like structure.
The prompt above was compiled from the original drawing commands and is for reference only.