
Array of Dots: Adjustable Dot Grid
Loading the math board and drawing, please wait…
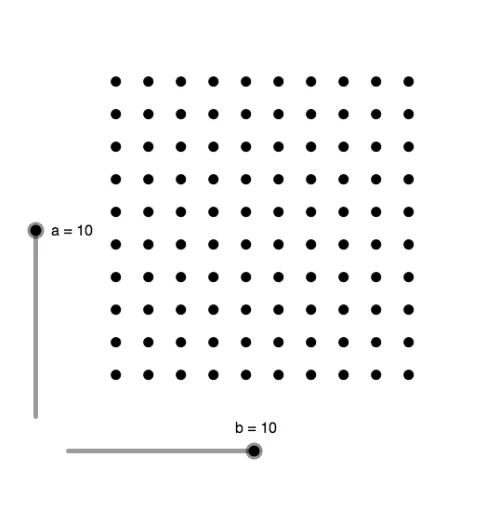
① This example demonstrates how to create adjustable arrays of dots in GeoGebra, where dots are arranged in rows and columns to visualize multiplication, area, or combinatorial counting. ② Core mathematical concepts include area, numbers, combinatorics, and arithmetic mean; the dot array helps students understand the relationship between multiplication and area, and can be used to explore counting problems. ③ Construction uses the Sequence command with parameters a and b to control the number of rows and columns, generating the list L_1; teachers can drag sliders to change a and b and observe the total number of dots. ④ Suitable for upper elementary to middle school for area and multiplication visualization, or high school for introductory combinatorics; also serves as a template for teachers to create interactive exercises that support student exploration of array patterns.
GeoGebra Commands & Parameters
Sequence(Sequence[(n, m), n, 0, a - 1], m, 0, b - 1) → L_1
AI Drawing Prompt Reference
Create an adjustable dot grid consisting of evenly spaced dots arranged in rows and columns. The number of rows and columns can be changed by two sliders, allowing the grid to expand or shrink dynamically. Each dot is identical in size and positioned uniformly within a rectangular area, forming a visual pattern useful for demonstrating multiplication, area, or counting. The overall design is clean and educational, suitable for interactive teaching.
The prompt above was compiled from the original drawing commands and is for reference only.