
Area Histograms: Choose Your Zones
Loading the math board and drawing, please wait…
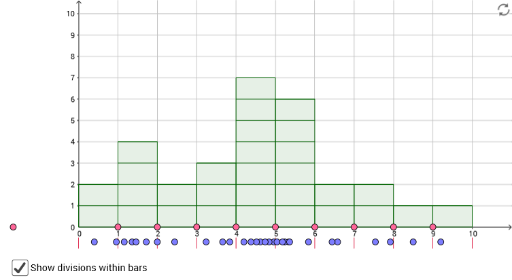
This example demonstrates area histograms by selecting different zones. Key mathematical concepts include area calculation, histogram in statistics, and integral calculus. Using GeoGebra commands such as Append, Insert, and Point, a dynamic area histogram can be constructed. Suitable for high school and above students or teachers for teaching and learning.
GeoGebra Commands & Parameters
Append(dividerlist, 10) → barrightsInsert(0, dividerlist, 1) → barleftsPoint(Segment[(0, pointheight), (10, pointheight)]) → A1Point(Segment[(0, pointheight), (10, pointheight)]) → A2Point(Segment[(0, pointheight), (10, pointheight)]) → A3Point(Segment[(0, pointheight), (10, pointheight)]) → A4Point(Segment[(0, pointheight), (10, pointheight)]) → A5Point(Segment[(0, pointheight), (10, pointheight)]) → A6Point(Segment[(0, pointheight), (10, pointheight)]) → A7Point(Segment[(0, pointheight), (10, pointheight)]) → A8Point(Segment[(0, pointheight), (10, pointheight)]) → A9Point(Segment[(0, pointheight), (10, pointheight)]) → A10Point(Segment[(0, pointheight), (10, pointheight)]) → A11Point(Segment[(0, pointheight), (10, pointheight)]) → A12Point(Segment[(0, pointheight), (10, pointheight)]) → A13Point(Segment[(0, pointheight), (10, pointheight)]) → A14Point(Segment[(0, pointheight), (10, pointheight)]) → A15Point(Segment[(0, pointheight), (10, pointheight)]) → A16Point(Segment[(0, pointheight), (10, pointheight)]) → A17Point(Segment[(0, pointheight), (10, pointheight)]) → A18Point(Segment[(0, pointheight), (10, pointheight)]) → A19Point(Segment[(0, pointheight), (10, pointheight)]) → A20Point(Segment[(0, pointheight), (10, pointheight)]) → A21Point(Segment[(0, pointheight), (10, pointheight)]) → A22Point(Segment[(0, pointheight), (10, pointheight)]) → A23Point(Segment[(0, pointheight), (10, pointheight)]) → A24Point(Segment[(0, pointheight), (10, pointheight)]) → A25Point(Segment[(0, pointheight), (10, pointheight)]) → A26Point(Segment[(0, pointheight), (10, pointheight)]) → A27Point(Segment[(0, pointheight), (10, pointheight)]) → A28Point(Segment[(0, pointheight), (10, pointheight)]) → A29Point(Segment[(0, pointheight), (10, pointheight)]) → A30Point(xAxis) → B1Point(xAxis) → B2Point(xAxis) → B3Point(xAxis) → B4Point(xAxis) → B5Point(xAxis) → B6Point(xAxis) → B7Point(xAxis) → B8Point(xAxis) → B9Point(xAxis) → B10Length(dividerlist) → numdividersZip(Sum[(x(A1:A30) ≥ L) ∧ (x(A1:A30) < R)], L, barlefts, R, barrights) → barcountsSum(barcounts) → aZip(R - L, L, barlefts, R, barrights) → barwidthsSum(barwidths) → bZip(Polygon[{(L, 0), (L, H), (R, H), (R, 0)}], L, barlefts, R, barrights, H, barheights) → barsSum(bars) → cZip(Segment[(L, -0.5), (L, -1)], L, Append[barlefts, 10]) → list1Zip(Zip[Segment[(L, (H / N * j)), (R, (H / N * j))], j, Sequence[N]], L, barlefts, R, barrights, H, barheights, N, barcounts) → bardividers