
Confidence Interval for Standard Deviation
Loading the math board and drawing, please wait…
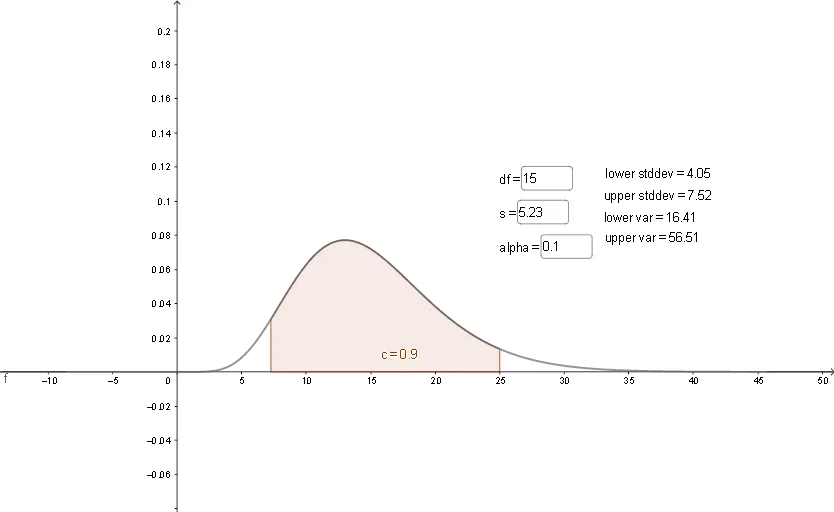
This example demonstrates how to construct confidence intervals for standard deviation and variance using GeoGebra. Key math concepts include confidence intervals, standard deviation, variance, chi-squared distribution, and integral calculations. GeoGebra commands used are InverseChiSquared, Textfield, ChiSquared, Integral, along with objects like df, p, a, b, s, lower, upper, InputBoxes, and text elements. Suitable for high school and above students learning statistical inference and visualization.
GeoGebra Commands & Parameters
InverseChiSquared(df, p / 2) → aInverseChiSquared(df, 1 - p / 2) → bTextfield(df) → InputBox1Textfield(s) → InputBox2Textfield(p) → InputBox3ChiSquared(df, x, false) → fIntegral(f(x), a, b, true) → c
AI Drawing Prompt Reference
Draw a graph showing a confidence interval for standard deviation. The graph includes input boxes for df, p, and s. It also features two key points a and b representing the lower and upper limits of the interval. The area between a and b is calculated using an integral, and these elements are labeled with text. The overall design is simple and clear, suitable for statistical teaching and visualization.
The prompt above was compiled from the original drawing commands and is for reference only.