
Confidence Intervals for Standard Deviation and Variance
Loading the math board and drawing, please wait…
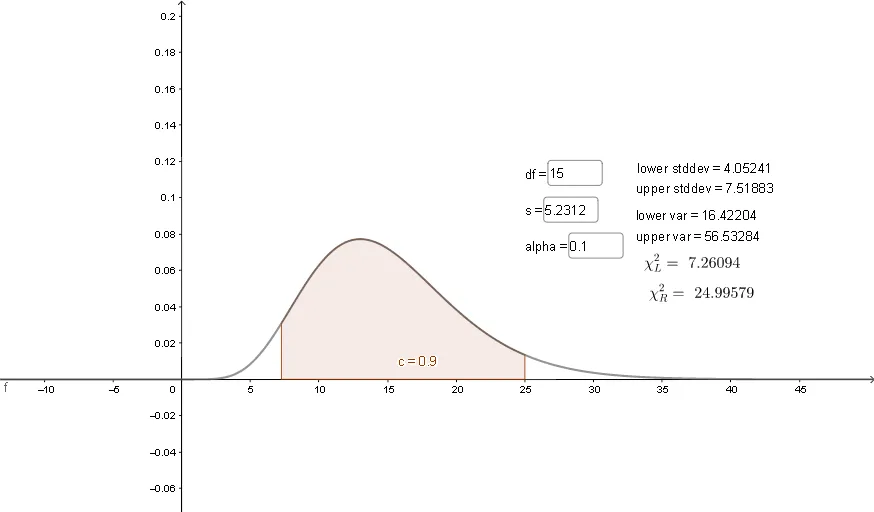
① This interactive GeoGebra example demonstrates how to construct confidence intervals for population variance and standard deviation based on sample statistics, with dynamic sliders and input boxes showing how interval width changes with confidence level. ② Core mathematical concepts include the chi-square distribution, confidence intervals, estimation of variance and standard deviation, and the use of the inverse chi-square function to find critical values. ③ Construction details: The commands InverseChiSquared, ChiSquared, and Integral are used to compute critical values, plot the density curve, and calculate probabilities; sliders for degrees of freedom (df) and confidence level (p) control the parameters; input boxes (InputBox1-3) allow adjusting sample variance (s); objects lower, upper, lowervar, uppervar store the interval bounds for variance and standard deviation; text objects (text1-6) display formulas and results. ④ Suitable for advanced high school or introductory college statistics courses, this tool helps students understand the logic of confidence intervals, the role of degrees of freedom in the chi-square distribution, and the uncertainty in variance estimation. It serves as an effective classroom demonstration or self-paced exploration tool.
GeoGebra Commands & Parameters
InverseChiSquared(df, p / 2) → aInverseChiSquared(df, 1 - p / 2) → bTextfield(df) → InputBox1Textfield(s) → InputBox2Textfield(p) → InputBox3ChiSquared(df, x, false) → fIntegral(f(x), a, b, true) → c
AI Drawing Prompt Reference
Create an interactive visualization for confidence intervals of population variance and standard deviation. Include three adjustable inputs: degrees of freedom (df), confidence level (p), and sample variance (s). Using the chi-square distribution with df, determine two critical bounds corresponding to p/2 and 1−p/2, and use these to locate the interval endpoints for the variance; then derive the corresponding lower and upper bounds for the standard deviation from the variance interval. Plot the chi-square density curve on the same figure and visually indicate the probability area between the two critical points. Add text formulas to present the key quantities used in computing the critical values and the resulting interval expressions, emphasizing how the interval width changes as p varies.
The prompt above was compiled from the original drawing commands and is for reference only.