
Area Between Two Curves Estimation
Loading the math board and drawing, please wait…
In collections
Calculus - Applications of Integrals - Areas and Volumes
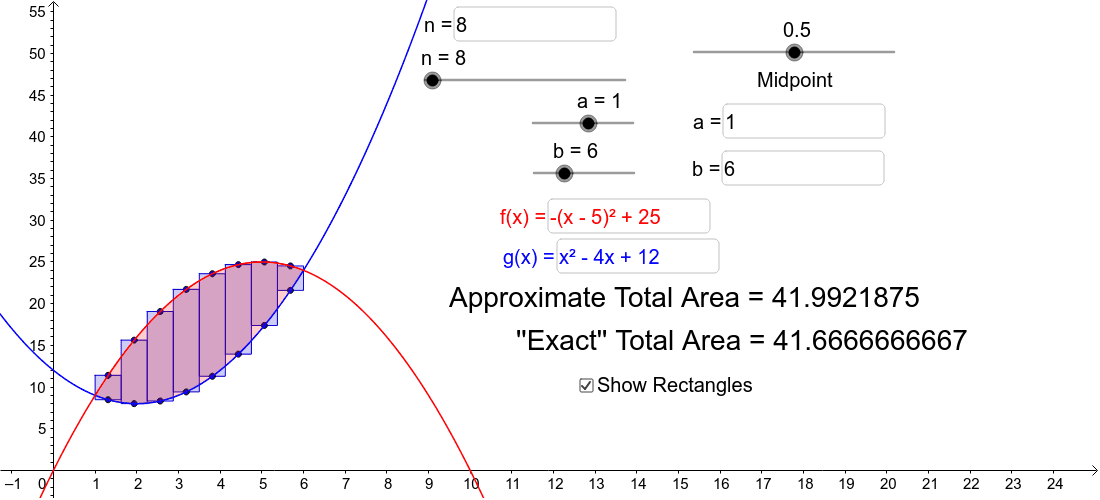
This example demonstrates how to estimate the area between the graphs of two functions using midpoint, left-endpoint, and right-endpoint approximation methods. Key mathematical concepts include integration and approximation methods. It utilizes GeoGebra commands such as Sequence, Sum, Textfield, and IntegralBetween. Suitable for high school mathematics education or learning integration concepts.
GeoGebra Commands & Parameters
Sequence((a + ((b - a) / n * (k - lmr)), f(a + ((b - a) / n * (k - lmr)))), k, 1, n, 1) → RectangleHeightsSequence(Polygon[(a + ((b - a) / n * (k - 1)), f(a + ((b - a) / n * (k - lmr)))), (a + ((b - a) / n * k), f(a + ((b - a) / n * (k - lmr)))), (a + ((b - a) / n * k), g(a + ((b - a) / n * (k - lmr)))), (a + ((b - a) / n * (k - 1)), g(a + ((b - a) / n * (k - lmr)))), (a + ((b - a) / n * (k - 1)), f(a + ((b - a) / n * (k - lmr))))], k, 1, n, 1) → RectangleAreasSum(RectangleAreas) → ApproxTotalAreaTextfield(a) → inputBox1Textfield(b) → inputBox2Sequence((abs(f(a + ((k - lmr) * (b - a) / n))) * (b - a) / n), k, 1, n, 1) → list2IntegralBetween(f(x) - g(x), 0, a, b) → ExactTotalAreaTextfield(n) → inputBox3Textfield(f) → inputBox4Sequence((a + ((b - a) / n * (k - lmr)), g(a + ((b - a) / n * (k - lmr)))), k, 1, n, 1) → list1Textfield(g) → inputBox5IntegralBetween(f, g, a, b) → e
AI Drawing Prompt Reference
Draw two function curves and the area between them, estimating the area using different methods. First, show the function curves, then represent the midpoint, left-endpoint, and right-endpoint approximation methods by calculating and drawing multiple small rectangles, each in a different color or style. Next, display the approximate and exact areas next to the graph for each method, and label the input functions, interval, and number of divisions.
The prompt above was compiled from the original drawing commands and is for reference only.