
Polar Conic Sections Demo
Loading the math board and drawing, please wait…
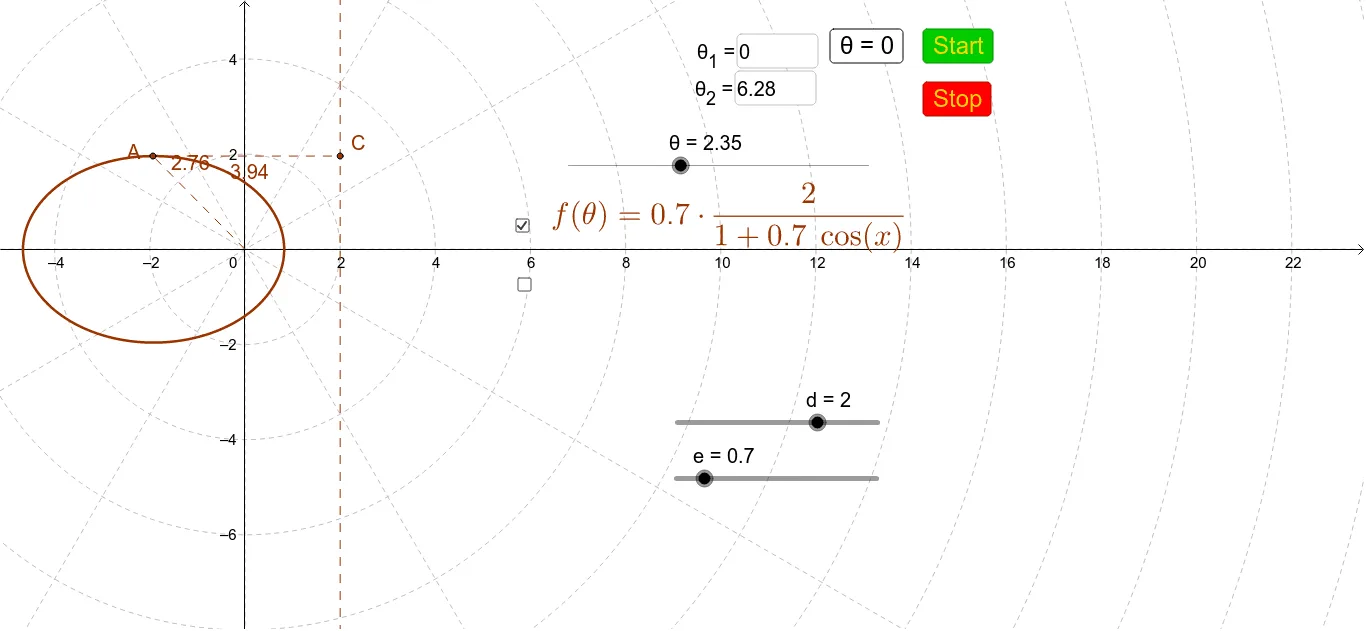
This example demonstrates polar conic sections by varying the directrix and eccentricity, showcasing how ellipses, hyperbolas, and parabolas are formed in polar coordinates. It involves key math concepts like polar equations, conic section definitions, and the effect of eccentricity on curve shapes. Constructed using GeoGebra commands like Textfield, CurveCartesian, and Segment, with sliders for dynamic visualization. Ideal for high school mathematics education to intuitively understand the geometric nature and parametric equations of conic sections.
GeoGebra Commands & Parameters
Textfield(f) → inputBox1Textfield(θ_1) → inputBox2Textfield(θ_2) → inputBox3Textfield(g) → inputBox4CurveCartesian((f(θ) * cos(θ)), (f(θ) * sin(θ)), θ, θ_1, θ_2) → d_1Segment((0, 0), (((-10) * cos(θ)), ((-10) * sin(θ)))) → cCurveCartesian((g(θ) * cos(θ)), (g(θ) * sin(θ)), θ, θ_1, θ_2) → iSegment(A, C) → mSegment((0, 0), A) → hSegment(B, D) → pSegment((0, 0), B) → q