
AQR Section 17: Dot Plot and Box‑and‑Whisker Plot
Loading the math board and drawing, please wait…
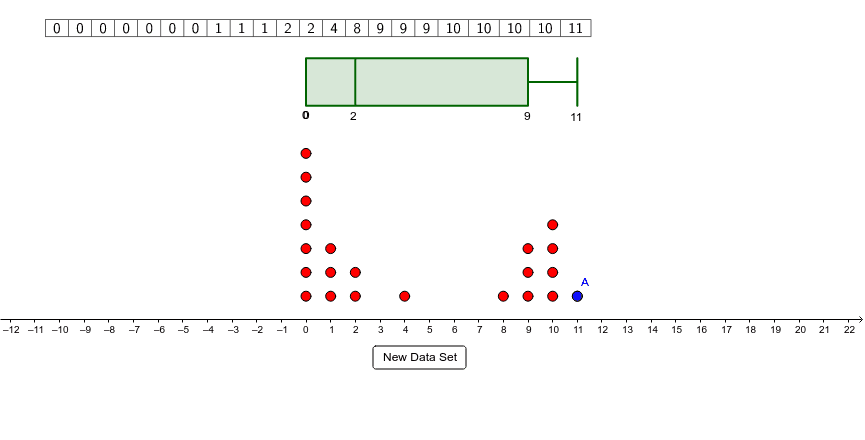
This GeoGebra applet illustrates the creation of dot plots and box‑and‑whisker plots as part of AQR Section 17. By dragging point A, learners see how individual data values reshape the box plot’s quartiles, median, and whiskers. The underlying mathematics involves data ordering, median, first and third quartiles (Q1, Q3), minimum and maximum values, and overall distribution visualization. The construction uses GeoGebra commands such as Point, Sequence, Append, DotPlot, BoxPlot, Min, Max, Q1, Q3, Median, Sort, and TableText, together with objects like lists, buttons, and text fields to produce an interactive learning environment. Designed for high‑school statistics, data‑analysis, or mathematics‑informatics classes, the example supports exploration of statistical graphics and dynamic data manipulation.
GeoGebra Commands & Parameters
Point(Segment[(-10, 1), (20, 1)]) → ASequence(Random[0, 10] + a - a, a, 10, Random[20, 40]) → list1Append(list1, x(A)) → list2DotPlot(list2) → list3BoxPlot(10, 1, list2) → aMin(list2) → mminMax(list2) → mmaxQ1(list2) → qq1Q3(list2) → qq3Median(list2) → mmedSort(list2) → list4TableText({list4}, "c|_") → text6