
Approximating Small Angles Using Graphs
Loading the math board and drawing, please wait…
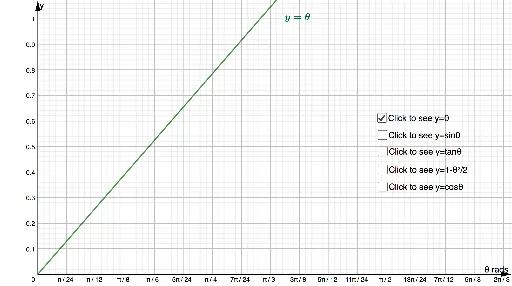
This example demonstrates how to approximate small angles using graphs. It involves the concept of angle measurement in radians. By constructing functions f, g, h, and using line segments, points, and text objects, the relationship between angles and radians can be visually understood. Suitable for high school mathematics education or learning.
GeoGebra Commands & Parameters
f(x) = If[x ≥ 0, x]g(x) = If[x ≥ 0, sin(x)]h(x) = If[x ≥ 0, tan(x)]p(x) = If[0 ≤ x ≤ 1.41, 1 - x^(2) / 2]q(x) = If[0 ≤ x ≤ π / 2, cos(x)]Boolean a(true)Boolean b(false)Boolean c(false)Boolean d(false)Boolean e(false)
AI Drawing Prompt Reference
Draw on a coordinate plane the three curves y = x, y = sin x, and y = tan x for x ≥ 0, together with the parabola y = 1 − x²/2 defined on 0 ≤ x ≤ 1.41 and the cosine curve y = cos x defined on 0 ≤ x ≤ π/2; distinguish each function by color or line style, label the small‑angle approximation relationships, and include five boolean toggles to show or hide each curve individually.
The prompt above was compiled from the original drawing commands and is for reference only.