
Approximating a Binomial Distribution by a Normal Distribution
Loading the math board and drawing, please wait…
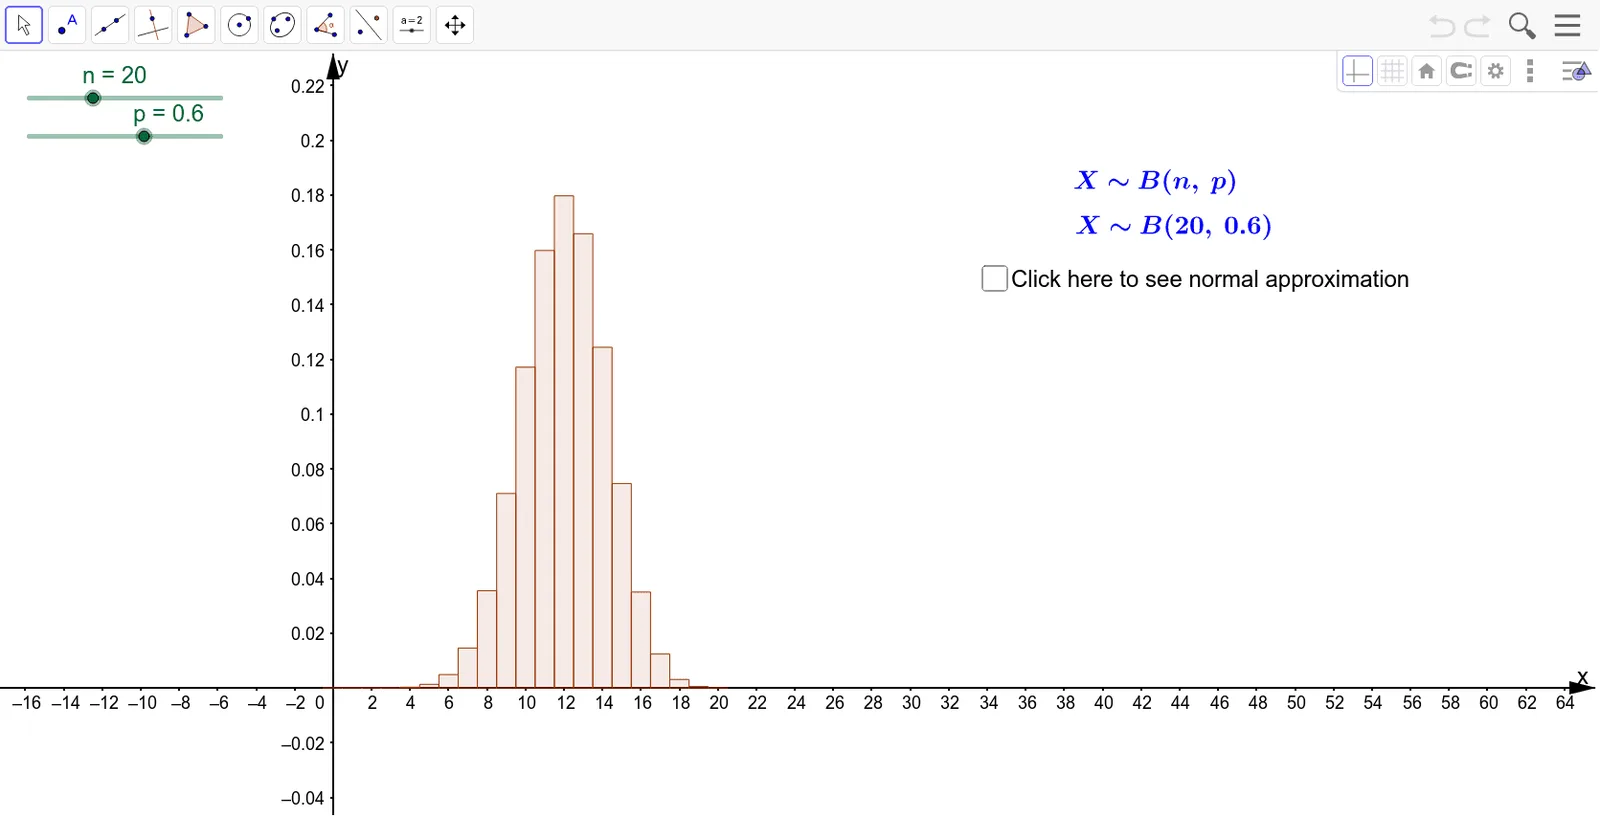
① This example dynamically demonstrates how the binomial probability mass function is approximated by a normal distribution curve as the number of trials n increases, illustrating the central limit theorem visually. ② Core mathematical concepts include binomial distribution, normal distribution, probability density function, mean and standard deviation, and the limiting behavior of distributions. ③ Construction highlights: uses GeoGebra commands BinomialDist to generate the binomial point sequence and Normal to plot the normal curve, with sliders for n and p; objects include n, p, a, f, np, b, c, text6, text7, text2, text3, text8, and d, where np represents the mean and d likely controls the standard deviation or deviation. ④ Suitable for high school to early college probability and statistics courses, serving as a classroom demonstration or self-exploration tool to understand the connection between discrete and continuous distributions.
GeoGebra Commands & Parameters
BinomialDist(n, p) → aNormal((n * p), sqrt((n * (p * (1 - p)))), x, false) → f
AI Drawing Prompt Reference
Create a dynamic graph showing how a binomial probability mass function approximates a normal distribution curve as the number of trials increases. Include sliders for the number of trials and success probability. Plot the binomial distribution as discrete points, with each point's height representing its probability. Overlay a continuous normal curve whose mean equals the binomial mean and standard deviation equals the binomial standard deviation. As the trial count grows, the discrete points should align closely with the smooth curve, visually demonstrating the central limit theorem. Add labels for the mean and standard deviation.
The prompt above was compiled from the original drawing commands and is for reference only.