
Animation Demonstrating Parabola and Riemann Sums
Loading the math board and drawing, please wait…
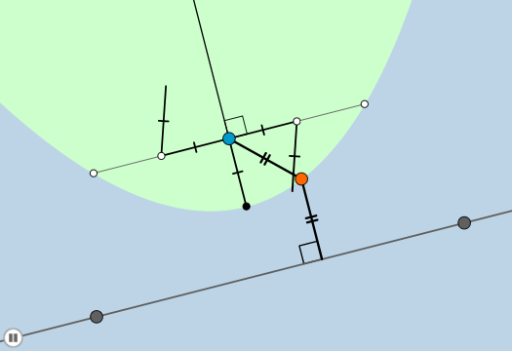
This example demonstrates the relationship between a parabola and the sums of rectangles, showing how upper and lower sums approximate the area under the parabola through animation. Key math concepts include parabola, general quadrilateral, upper and lower sums (Riemann sums), correlation, random variables, and rational numbers. It uses commands like Line, Parabola, Point, OrthogonalLine, Intersect, Dilate, Segment, Angle, Rotate, Circle, Ray in GeoGebra for construction. Suitable for high school mathematics education to understand the concept of Riemann integration.
GeoGebra Commands & Parameters
Line(A, B) → aParabola(C, a) → cPoint(c) → DOrthogonalLine(D, a) → bIntersect(a, b) → EDilate(C, If[0 < d ≤ 1, 1 - d, 0], D) → C'Segment(C, C') → eDilate(D, If[1 < d ≤ 2, 2 - d, 0], E) → D'Segment(D, D') → fAngle(A, E, D) → αAngle(E, D, C) → βRotate(C, If[2 < d ≤ 3, ((-(d - 2)) * β), (-β)], D) → C'_1Rotate(C', If[2 < d ≤ 3, ((-(d - 2)) * β), (-β)], D) → C''Segment(C'_1, C'') → e'OrthogonalLine(C, a) → gIntersect(c, g) → V, SOrthogonalLine(C, g) → hIntersect(c, h) → G, HCircle(C, 2) → kIntersect(k, c, 1) → IIntersect(k, c, 1) → JIntersect(k, g) → K, LSegment(V, C) → iCircle(G, i) → pIntersect(p, h) → F, MCircle(H, i) → qIntersect(q, h) → N, ORay(C, L) → jAngle(M, C, L) → γDilate(V, If[3 < d ≤ 4, 4 - d, 0], C) → V'Segment(V, V') → lDilate(G, If[5 < d ≤ 6, 6 - d, 0], M) → G'Segment(G, G') → mDilate(M, If[6 < d ≤ 7, 7 - d, 0], C) → M'Segment(M, M') → nDilate(C, If[7 < d ≤ 8, 8 - d, 0], N) → C'_2Segment(C, C'_2) → rDilate(N, If[8 < d ≤ 9, 9 - d, 0], H) → N'Segment(N, N') → sRotate(V, If[9 < d ≤ 10, ((d - 9) * π / 2), π / 2], C) → V'_1Rotate(V', If[9 < d ≤ 10, ((d - 9) * π / 2), π / 2], C) → V''Segment(V'_1, V'') → l'Rotate(V, If[9 < d ≤ 10, ((-(d - 9)) * π / 2), ((-π)) / 2], C) → V'_2Rotate(V', If[9 < d ≤ 10, ((-(d - 9)) * π / 2), ((-π)) / 2], C) → V''_1Segment(V'_2, V''_1) → l'_1Rotate(V'_1, If[10 < d ≤ 11, ((d - 10) * π), π], M) → PRotate(V'', If[10 < d ≤ 11, ((d - 10) * π), π], M) → V'''Segment(P, V''') → l''Rotate(V'_2, If[10 < d ≤ 11, ((d - 10) * π), π], N) → QRotate(V''_1, If[10 < d ≤ 11, ((d - 10) * π), π], N) → RSegment(Q, R) → t
AI Drawing Prompt Reference
Draw a parabola and demonstrate the process of approximating the area under the parabola using upper and lower sums. Start by drawing a line AB, then construct a parabola c with vertex C. Next, take a point D on the parabola and draw a perpendicular line b from D to line AB, finding their intersection point E. Perform a series of rotations, dilations, and intersection operations to gradually build multiple rectangles, illustrating the approximation process.
The prompt above was compiled from the original drawing commands and is for reference only.