
Animated Area Paradox: Area Differences Under Rotation and Partition
Loading the math board and drawing, please wait…
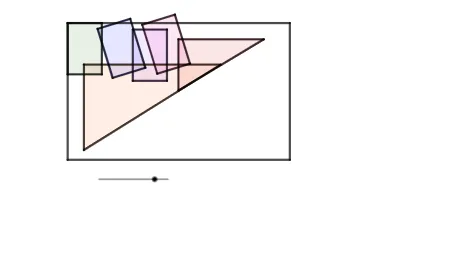
This example uses an animation to demonstrate an “area paradox” phenomenon: when a configuration of regions is rotated and partitioned, the displayed area difference (or an equivalent quantity) can behave in a way that challenges naive intuition. The central math ideas include polygon area relationships, coordinate-geometry construction via intersection points, and geometry transformations—rotation and translation—implemented through vectors and line segments to precisely define the evolving boundaries. From the construction summary, the diagram is built with Polygon to create the base regions; Rotate to change their orientation over time; Intersect to compute the key intersection points that determine how the regions are split; and Vector plus Segment to represent directions and boundary pieces. Translate is used to align or shift configurations for comparison across frames. A structured set of parameter objects (e.g., a, b, c, d and q1, q2, e, f, g, h, t along with starred variants) drives the dynamic construction and the animated area comparisons. The activity is well-suited for high school through early undergraduate use in dynamic geometry, coordinate geometry, and conceptual instruction about why apparent area conclusions may depend on the exact construction and partitioning rules.
GeoGebra Commands & Parameters
Polygon(A, B, C, D) → q1, a, b, c, dPolygon(E, F, G, H) → q2, e, f, g, hRotate(E, (-((90 * t°))), I) → E'Rotate(F, (-((90 * t°))), I) → F'Rotate(G, (-((90 * t°))), I) → G'Rotate(H, (-((90 * t°))), I) → H'Polygon(E', F', G', H') → q2', e', f', g', h'Polygon(J, K, L, M) → q3, j, k, l, mIntersect(xAxis, yAxis) → NVector(N, O) → uTranslate(J, v) → J'Translate(K, v) → K'Translate(L, v) → L'Translate(M, v) → M'Polygon(J', K', L', M') → q3', j', k', l', m'Polygon(Q, R, S, T) → q4, q, r, s, t_1Rotate(Q, (-((90 * t°))), U) → Q'Rotate(R, (-((90 * t°))), U) → R'Rotate(S, (-((90 * t°))), U) → S'Rotate(T, (-((90 * t°))), U) → T'Polygon(Q', R', S', T') → q4', q', r', s', t'Polygon(V, W, Z) → t1, z_1, v_1, wVector(A_1, B_1) → iTranslate(V, n) → V'Translate(W, n) → W'Translate(Z, n) → Z'Polygon(V', W', Z') → t1', z', v', w'Polygon(C_1, D_1, E_1) → t2, e_1, c_1, d_1Vector(F_1, G_1) → pTranslate(C_1, u_1) → H_1Translate(D_1, u_1) → I_1Translate(E_1, u_1) → J_1Polygon(H_1, I_1, J_1) → t2', j_1, h_1, i_1Intersect(a, d) → K_1Segment(A, E) → f_1Segment(E, C) → g_1Segment(C, Q) → k_1Segment(Q, A) → l_1Segment(H', E') → m_1Segment(E', F') → n_1Segment(G', F') → p_1Segment(G', H') → q_1Segment(V', Z') → r_1Segment(W', Z') → s_1Segment(V', W') → a_1Segment(J_1, H_1) → b_1Segment(H_1, I_1) → f_2Segment(I_1, J_1) → g_2Segment(T', Q') → h_2Segment(Q', R') → i_2Segment(R', S') → j_2Segment(S', T') → k_2Segment(M', L') → l_2Segment(K', L') → m_2Segment(K', J') → n_2Segment(J', M') → p_2Segment(A, N_1) → q_2Segment(N_1, M_1) → r_2Segment(M_1, L_1) → s_2Segment(L_1, A) → t_2
AI Drawing Prompt Reference
This is a dynamic geometric figure illustrating how the area difference of a region changes under rotation and partitioning. The figure includes initial polygons, rotated polygons, translated polygons, and partition lines. The construction order is: first draw initial polygons, then rotate them to change orientation, then translate to align configurations, and finally draw partition lines to define boundaries. The figure aims to illustrate the area paradox phenomenon, showing how rotation and partitioning affect area calculations.
The prompt above was compiled from the original drawing commands and is for reference only.