
Anatomy of a Logarithmic Function via Geometric Construction
Loading the math board and drawing, please wait…
In collections
Graphing Logarithmic Functions
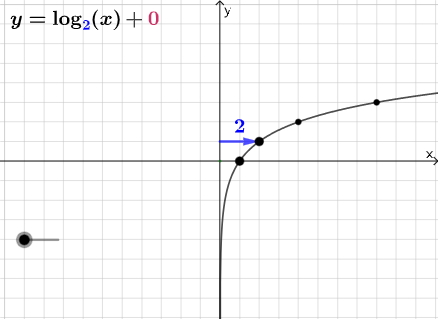
This GeoGebra example demonstrates a “geometric anatomy” approach to a logarithmic function, showing how logarithmic relationships can be translated into a constructible, visual setup that reveals graph behavior and key readable features. It focuses on core topics such as logarithmic functions, function graphing, and the use of geometric constraints to support algebraic relationships. The construction is built using GeoGebra commands Point, Intersect, and Vector: many labeled points (e.g., A, B, C, D, E, F, G, H, I, J, K, L and auxiliary points like g, h, i) establish the scaffold of the diagram, while eq1 and eq2 capture the underlying equation/constraint relationships. Vector objects (from the construction summary such as c, d, e and u, v, w families) encode direction and proportional structure, and intersection operations determine critical locations that drive the final graph interpretation. Suitable for secondary school learners and introductory function modules, especially for lessons that combine algebraic functions with interactive geometry-based intuition.
GeoGebra Commands & Parameters
Point(Ray[B + (1, 1), B + (2, 1)]) → CPoint(Ray[B + (1, -1), B + (2, -1)]) → DIntersect(xAxis, yAxis) → GVector(G, A) → uVector(H, B) → vIntersect(eq1, y = y(C)) → IIntersect(eq1, y = y(D)) → JVector(I, C) → wVector(J, D) → j
AI Drawing Prompt Reference
Draw a geometric construction of a logarithmic function, including points C and D on two rays with slopes 1 and -1, point G at the intersection of the x-axis and y-axis, vector u from G to A, vector v from H to B, points I and J as intersections of line eq1 with lines perpendicular to CD, vector w from I to C, and vector j from J to D.
The prompt above was compiled from the original drawing commands and is for reference only.