
Al Horford Parabola: Modeling a Ball with Quadratics
Loading the math board and drawing, please wait…
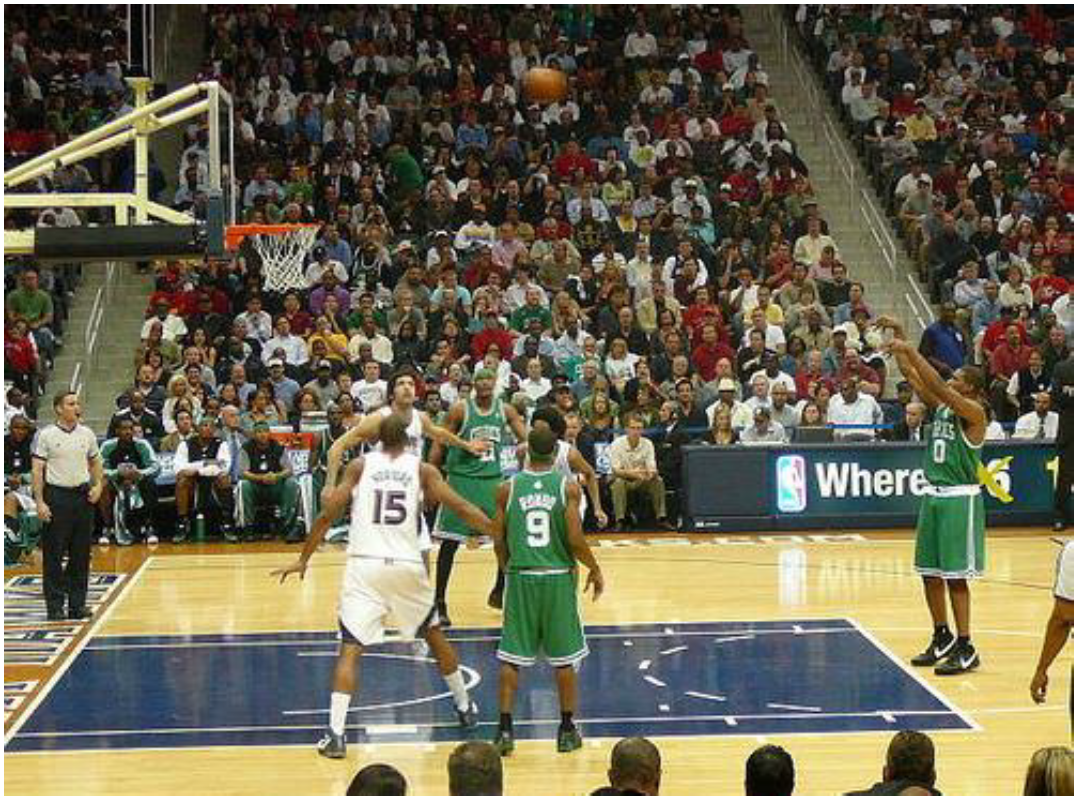
This example demonstrates how a “ball” (or its trajectory/shape behavior) can be modeled using a quadratic curve in GeoGebra. It focuses on the geometric meaning of quadratic functions and how the parabola’s key features—such as special points (e.g., vertex/intersections)—follow from carefully chosen defining elements. The construction also encourages a differential-calculus viewpoint: reasoning about slope and extrema via derivative-based intuition to understand why the curve behaves as it does. In the build, GeoGebra uses constructed objects labeled A, B, C, D, E together with a figure/image object (imagen1) to set up the necessary constraints and then determine the resulting parabola that represents the model. Suitable for upper-secondary to early university use, especially for lessons on graphing, coordinate geometry, curve properties, and introductory modeling with quadratics.
GeoGebra Commands & Parameters
Point A(-2.1762978304297302, -1.6900044413472683)Point B(14.36930216957027, -1.6900044413472683)(6.2, 9.4)(11.4, 5.6)Point E(-4.615504204043301, 10.53454541511485)
AI Drawing Prompt Reference
Draw a parabola to model a basketball's trajectory. Start by creating points A(-2.18, -1.69) and B(14.37, -1.69) as the endpoints of the parabola. Then, add points C(6.2, 9.4) and D(11.4, 5.6) as control points for the parabola. Finally, use points A, B, C, D, and E(-4.62, 10.53) to construct the parabola, simulating the basketball's motion.
The prompt above was compiled from the original drawing commands and is for reference only.